Saturday, September 25, 2021

IGY Bulletin, Number 3, September 1957 - Ionospheric Physics Program

The next article in this issue of the IGY Bulletin introduces plans for the Ionopsheric Physics Program. The main part of the program was to send vertical radio wave pulses into the ionosophere that would be reflected back to the Earth's surface and recorded as ionograms. (If you've ever picked up radio stations from hundreds of miles away, that's due to radio waves reflected from the ionosphere, although not vertically.) Unique relationships exist between the frequency of the waves and the electron densities which can reflect it. As the signals sweep across different frequencies, they are reflected from the different layers of the ionosphere. Altitude of the different layers of the ionosphere can be derived from the up-down travel times of the waves. Electron densities in the layers can also be inferred from how much of the upgoing radio wave energy is absorbed before being returned to Earth.

More information on the ionosphere can be derived from naturally occurring radio pulses which originate from lightning discharges, also called sferics. Specific types of sferics are called tweeks and whistlers.

This "sounding" of the ionosphere is somewhat analogous to using seismic waves to probe different layers in the subsurface of the solid Earth. Like with ionosphere probing, the seismic soundings can be based on natural waves from earthquakes, or artificially induced seismic waves, depending on the nature of the study. I've often been impressed how the physics of waves are applicable to so many different phenomena.

The details of the rest of the article are more technical than you (or I) will want to get into, so let's leave it at that.

One international society that focuses on both internal and external aspects of the Earth's magnetic field is the International Society of Geomagnetism and Aeronomy (IAGA). IAGA is organized into six divisions: internal magnetic fields; aeronomic phenomena; magnetospheric phenomena; solar wind and interplanetary field; geomagnetic observatories, surveys and analyses; electromagnetic induction in the Earth and planetary bodies. Aeronomy is a term we haven't encountered here yet; it deals with "the dynamics, chemistry, energetics and electrodynamics of the atmosphere-ionosphere system as well as the coupling processes." 

I've been to a number of IAGA meetings which meets every two years, alternating between its own Special Assembly and joint General Assemblies with seven other international scientific associations that are all part of the International Union of Geodesy and Geophysics (IUGG). The IUGG  is a non-governmental, scientific organization established in 1919 for international promotion and coordination of scientific studies of the Earth (physical, chemical, and mathematical) and its environment in space. 

One of the meetings I went to was IAGA 2009 in Sopron, Hungary. A related stamp was made available to us at the meeting. I bought a pane, and also sent a cover to myself back home. "Magyarország" on the stamp just means Hungary, and "Belföld" is domestic (hence more stamps were added to make up the international rate. I think the instrument in the image is a sun compass. Notice that the selvage (margins of the stamps) on the pane commemorates the meeting.

Pane of stamps with "IAGA" in the selvage of the stamps, and a plate number in the selvage of the pane

Front of IAGA 2009 postcard sent home, with the IAGA postmark

Back of the postcard, showing the conference venue, the Liszt Ferenc Conference and Cultural Center

IAGA recently started a blog for promoting the work done by the IAGA community and portraying the life of its researchers. The blog is maintained by the Social Media (SM) Working Group in order to provide an easily accessible platform for news and information and to act as a bridge connecting the scientists and their research with the general public. I am pleased that the IAGA blog gives this blog a shoutout in its latest post. Thanks to Shivangi Sharan for connecting with me.

Thursday, September 23, 2021

IGY Bulletin, Number 3, September 1957 - Geomagnetic Program

Geomagnetism (at least some aspects of it) was basically my own area of geophysical expertise. So I am going to give you a little history of my former areas of research, add a little tutorial of geomagnetism and paleomagnetism, and then summarize the contents of this IGY Bulletin article. Some of this material has come up in previous posts, but I won't cross-reference them.

After my B.S. in engineering physics at Cornell, I worked for two years for Fairchild Space and Electronics on satellite power subsystem analyses (solar cell arrays and rechargeable batteries). When I decided to go back to grad school, I wanted an area of applied physics that would allow me to pursue either more academic topics or applications to more "practical" problems. Geophysics, as I hope this blog has already shown, is chock full of academic problems. But geophysics also includes a suite of techniques useful in oil and minerals exploration, so I knew there was always that. Some would call this distinction "pure" vs. "applied" geophysics. I explored applied geophysics in corporate settings when, during grad school, I worked one summer for Amoco (oil), and another summer and part-time job with Newmont (mining). But in the end, I chose the academic route for my career.

Starting in my first year of grad school in geosciences at the University of Arizona, my research assistantship with Paul Damon on radiocarbon geophysics involved computer modeling of relationships between the Earth's magnetic field strength and production of carbon-14 by cosmic ray induced spallation in the atmosphere. At the same time, I took courses in geomagnetism and paleomagnetism from my second great academic mentor, Dr. Robert Butler, a gifted instructor and researcher. He then supervised my master's thesis and Ph.D. dissertation on archaeomagnetism (Sternberg, 1990): the use of baked clay archaeological materials (hearths and ceramics) to yield information on the past direction and strength of the magnetic field in the American Southwest. Time changes of the internal part (see below) of the magnetic field on the order of decades/centuries/millennia are called secular variation. Archaeomagnetism can also be used as an archaeological dating method by matching results from new features to these patterns of secular variation. 

Later in my career, I also used magnetic exploration methods (Burks, 2018) at various archaeological sites -- Pennsylvania, New York, Georgia, Jamaica, Greece, Italy, Azerbaijan -- to search for buried features and to delineate archaeological activity areas. Towards the end of my career, I examined magnetic properties of obsidian artifacts from New Mexico and Italy to see if their magnetic properties could be matched to geologic obsidian sources.

The Earth's magnetic field has an internal and an external component. The majority of energy resides in the internal magnetic field, which is depicted below. 


A schematic of an approximation to the Earth's internal magnetic field, having the shape of a dipole (bar magnet) tilted relative to the Earth's rotation axis

Einstein once called the origin of the Earth's magnetic field one of the greatest unsolved problems in physics (nor just geophysics), In the late 1940s, it was proposed that it is generated by dynamo action in the swirling electrically conducting molten iron fluids of the Earth's outer core. Changes of these fluid motions are responsible for the phenomenon of secular variation, and also reversals of the magnetic field which typically occur a few times per million years. Rocks can record information about ancient magnetic fields and preserve these like a tape recorder. These records of ancient magnetic fields and their application to geologic problems like continental drift comprises the field of paleomagnetism, of which archaeomagnetism is part. Paleomagnetism has developed greatly since the era of the IGY.

The geomagnetism studies of the IGY were focused on the external part of the Earth's magnetic field, which is due to charged particles moving in the ionosphere, much as an electrical current in a loop of wire will generate a magnetic field due to the Biot-Savart law. These charged particles emanate from the solar wind, then pass into the asymmetric magnetosphere (geomagnetic field) carved out of the interplanetary magnetic field, with the magnetopause being the boundary.

Schematic of the Earth's magnetosphere (Bagenal and Bartlett), encompassing the dipole field shown above

So, back to the article in the IGY Bulletin. If I understand correctly, it makes an error or at least poor choice of words. It states "analysis has shown that the very slow variations [secular variation] are due to the magnetic effects in the interior of the earth's crust and that the more rapid fluctuations arise from influences external to the earth -- in the upper atmosphere or even higher." So, the internal part of the geomagnetic field and secular variation derives from the core, which is below but not "in the interior of" the crust. But the distinction between rapid external field variations and slower internal field changes is useful and important.

The U.S. currently has 14 geomagnetic observatories, eight of which were in operation during the IGY.  A major goal of the IGY effort was to study magnetic storms related to solar activity. At that time, the correlation was clear, but the mechanism by which these phenomena were connected was not well understood. Additional regional networks of stations to record magnetic field information were established for the IGY. Measurements were taken every few seconds, using all the vector components (north-south, east-west, and up-down) of the magnetic field. Stations were set up on the magnetic equator, at U.S. Antarctic stations, and at Drifting Station A in the Arctic. It was anticipated that rockets and maybe even satellites would carry magnetometers (instruments to measure the magnetic field) higher up into the magnetosphere during the IGY.

Monday, September 20, 2021

IGY Bulletin, Number 3, September 1957 - Solar Activity Program; Cosmic Ray Program

These two IGY Bulletin articles elaborate on two related programs covering the different IGY sub-disciplines. 

Solar Activity Program

I have already posted a bit on the variation of solar activity during a solar cycle and on solar storms. The Bulletin article on the Solar Activity Program starts by noting that variations of the sun's activity had been recognized since shortly after the invention of the telescope in the early 1600s, when Galileo developed an improved telescope to enable him to discover and sketch sunspots.

For the IGY, principal goals for this program included warnings of expected geophysical effects of solar activity on terrestrial phenomena, and collecting comprehensive physical measurements of all measurable solar phenomena. Ten solar observatories in the U.S. were focused on these goals.

Solar flares were among the ten or so solar phenomena affecting the Earth that were observed. Observations at intervals of three minutes or less were taken at several stations, including the Mount Wilson Observatory (California) and the Sacramento Peak Sunspot Solar Observatory (actually located in Sunspot, New Mexico) which still exist. Today I purchased a cover postmarked from the location of the Sunspot Observatory, in Sunset, NM, on March 22, 1983 (25 years after the IGY), the date of launch of STS-3, the third mission for the Space Shuttle Columbia. It turned out that this shuttle was forced to land eight days later at White Sands, NM (only 50 miles southwest of Sacramento Peak), the only shuttle to do so, due to flooding at its originally planned landing site, Edwards Air Force Base.

My new cover (US 224) postmarked from Sunspot, NM, on launch date of the Space Shuttle (eBay image of the cover)

Among other solar measurements to be made, the Mount Wilson and Palomar Mountain Observatories were to map out the magnetic field of the solar disk on a daily basis using the Zeeman effect, whereby a magnetic fields splits spectral lines of the solar light emissions. Pieter Zeeman won the Nobel Prize in 1902 for discovering this effect

Cosmic Ray Program

The second article in this issue of IGY Bulletin is on the Cosmic Ray Program. Cosmic rays are actually highly energetic particles originating in space, from supernovas in other galaxies, and from our Sun. In a process called spallation, primary cosmic rays interact with molecules in Earth's atmosphere to produce a variety of secondary cosmic rays, i.e., different kinds of particles. These various particles  require different methods to indirectly detect cosmic rays via their by-products.

By-products of cosmic rays interacting with air molecules

The Bulletin article states that a number of projects (outlined in more detail than you would want to know) were to continuously measure cosmic ray intensity via secondary neutrons and mesons (i.e., pions/p-mesons and kaons/k-mesons) at the ground surface and also at elevations using balloons. These would enable the determination of cosmic ray particles' composition, masses, charges, and their changes over time. Measurements at different latitudes were made to consider the relation between the latitudinally variable geomagnetic field and cosmic ray intensities.

Among the scientific investigators mentioned in the article is S.F. Singer, then at the University of Maryland (my father had a barber shop in College Park at that time, a couple of miles from where we lived, so maybe he cut Singer's hair). Singer was present at a 1950 dinner party hosted by James Van Allen where the idea for the IGY was first hatched. He later became known as Fred Singer, a science contrarian (which I think is a generous term)  "who sought to denigrate other scientists who warned the public about secondhand smoke, greenhouse gas emissions, acid rain and the dangers of a steadily warming climate" (Washington Post).

My personal research connection with cosmic rays occurred in graduate school, when I was a research assistant with Dr. Paul Damon, one of the great mentors of my life. Among Paul's many interests was radiocarbon geophysics and the calibration of the radiocarbon timescale. Radiocarbon (i.e., radioactive carbon), aka carbon-14, is a radioactive isotope of carbon produced in our atmosphere as a spallation product of the interaction of cosmic rays with nitrogen, the most abundant element in our atmosphere. As the Earth's magnetic field changes strength over time (fodder for a future post), cosmic ray fluxes into the atmosphere change as well since charged cosmic ray particles are affected by magnetic fields. This changes the rate of radiocarbon production (e.g., Damon and Sternberg, 1989), which in turn affects carbon-14 dating; this means that carbon-14 dates have to be corrected for this effect.

To close, here is a contemporary tutorial and update on cosmic rays from Dr. Veronica Bindi, physics professor at the University of Hawaii:


Friday, September 17, 2021

IGY Bulletin, Number 3, September 1957 - Status Report: The Upper Atmosphere Program

Finally moving on to the September 1957 (64 years ago, almost senior citizen status) issue of the IGY Bulletin. I have posted this Bulletin as a pdf downloaded from the AGU archive of the Transactions, American Geophysical Union, vol. 38, #5, October, 1957.

This issue is 16 pages, comprising seven articles. The articles in this issue are listed below. The numbers in parentheses refer to the sub-disciplines covered by the IGY, as discussed in a previous post.

1. Status Report: The Upper Atmosphere Program (an introduction to the following articles)

2. Solar Activity Program (#6)

3. Cosmic Ray Program (#7)

4. Geomagnetism Program (#2)

5. Ionospheric Physics Program (#5)

6. Aurora and Airglow Program (#4)

7. Rocket Program (#11)

The short Status Report article, the topic of this post, explains that the next six articles deal with the various US-IGY programs in each of the atmosphere disciplines, with the final related section on the rocketry program.

The sun is of central importance in the high atmosphere. Its radiation causes ionization and chemical processes in the upper atmosphere. Disturbed solar conditions affect the ionosphere and radio communications, and often cause auroral, geomagnetic, and cosmic ray activity.

In a previous post, I included a diagram showing the stratification of the Earth's atmosphere. The atmosphere refers specifically to the layers of gas surrounding any planet, and their properties. The ionosphere is the ionized part of Earth's upper atmosphere, stretching from a height of about 50 km (30 mi) to more than 1,000 km (600 mi). It includes the atmospheric layers of the entire thermosphere and parts of the mesosphere and exosphere. Ionized by solar radiation, the ionosphere plays an important role in atmospheric electricity and forms the inner edge of the magnetosphere, the envelope containing the Earth's magnetic field. Airglow occurs when atoms and molecules in the upper atmosphere, excited by sunlight, emit light. This phenomenon is somewhat similar to auroras, which are driven by high-energy particles originating from the solar wind.

Atmosphere layers on left; ionosphere layers on right; phenomena and means of measurement in the center (NASA). Click on image to enlarge.

Sunday, September 12, 2021

IGY Bulletin, Number 2, August 1957 - Antarctic Notes

The last article in the second issue of the IGY Bulletin (August, 1958) was just a page of preliminary results from the Antarctic.

Weather at the South Pole

Some interesting early results:

1. A new world record for lowest temperature on the Earth's surface was measured as -100.4°F (-73.5°C) at the U.S. South Pole Station on May 11, 1957. (As of the present day, the lowest natural temperature ever directly recorded on the Earth's surface is  −128.6 °F (−89.2 °C) at the Soviet Vostok Station in Antarctica on 21 July 21, 1983.)

2. A few hundred feet above the surface at the Admundsen-Scott South Pole Station, the temperature increases as much as 50°F, then decreases at higher heights to the top of the troposphere.

3. Record high winds for Antarctica were also recorded at the South Pole, up to 47 knots.

For your interest, Wikipedia has a comprehensive list of weather records

Neutron Monitor Studies

A "neutron pile monitor" designed and built by John A. Simpson of the University of Chicago was installed on the icebreaker USS Arneb and operated during Operation Deep Freeze I and II from 1955-57.

A helpful note from Wikipedia: "A neutron monitor is a ground-based detector designed to measure the number of high-energy charged particles striking the Earth's atmosphere from outer space. For historical reasons the incoming particles are called "cosmic rays", but in fact they are particles, predominantly protons and Helium nuclei. Most of the time, a neutron monitor records galactic cosmic rays... Occasionally the Sun emits cosmic rays of sufficient energy and intensity to raise radiation levels on Earth's surface to the degree that they are readily detected by neutron monitors. They are termed 'ground level enhancements' (GLE)."

I mentioned the USS Arneb and an associated postmarked cover in an earlier post

Finally, the article notes that on Feb. 23, 1956, solar cosmic rays were measured in association with a solar flare, for only the 5th time. This was one of the notable historic solar storms. The Arneb, which measured solar cosmic rays at various latitudes as it sailed the seas,  detected particles from this flare while in the harbor at Wellington, New Zealand.

I have a book from the former library of John Simpson of the Enrico Fermi Institute for Nuclear Studies at the University of Chicago. The inscription inside the book is below.


The book was published in 1956 by the American Geophysical Union as Geophysical Monograph Number 1 (there are now 264 volumes in this series) with articles from a symposium on Antarctica in the International Geophysical Year:


The contents list an article by John Simpson himself on "Cosmic-ray experiments derived from recent U.S. Antarctic expeditions", and additional articles by noted scientists and IGY luminaries:

Friday, September 10, 2021

IGY Bulletin, Number 2, August 1957 - CSAGI and the International Geophysical Year

Ok, just this and one more short article to review from this second issue of the IGY Bulletin.

Remember that the words after the dash in the title of this post is the name of the article I am summarizing. So what is CSAGI? CSAGI is the acronym for Comité Spécial de l'Anée Géophysique Internationale, French for The Special Committee for the International Geophysical Year. This group was formed by the International Council for Scientific Unions (ICSU) to develop and coordinate the IGY. CSAGI met for the first time in October, 1952, almost 5 years before the start of the IGY, and organized a number of meetings after that to coordinate the various national committees working on the different subdisciplines of the IGY.

The officers of CSAGI were the following:
Sydney Chapman, President - bio
Lloyd V. Berkner, Vice President - bio
Marcel Nicolet, Secretary-General - bio
V. V. Beloussov - bio
Jean Coulomb - bio

I recently purchased an IGY first day cover signed by Sydney Chapman, one of the most accomplished geophysicists of the 20th century and a primary driving forces behind the IGY. This was one of my more expensive covers, but I had been searching for one signed by him so considered myself fortunate to find it.

US #215 in my IGY FDC collection

I don't think too much about possible forgeries in the philatelic items I buy, but one has to at leas contemplate that for more expensive items. Fortunately, Chapman's signature came with a certificate of authenticity, which I have chosen to trust.


The article also lists representatives to CSAGI from eight major international scientific societies, and reporters for each of the major geophysical subdisciplines covered by the IGY.

The article announced that Pergamon Press would be publishing 4-6 volumes of the Annals of the International Geophysical Year in 1957 and 1958, constituting a central record of IGY activity, proceedings, and technical manuals. Eventually, as best I can tell, 48 volumes were published from 1959-1970. One archive of the Annals is at the American Philosophical Society library in Philadelphia, only a train ride away for me, so before long I'll have to go have a look.

The Bulletin article also outlines the formation of the World Data Centers, organized to collate the data collected during the IGY from over 2000 stations by 10,000 scientists from over 60 countries. At the time, World Data Center A was the responsibility of the U.S., World Data Center B was set up in the Soviet Union, and World Data Center C was dispersed through Western Europe and the Pacific. The World Data Centers still exist today, as the World Data System.

Since the IGY, the ICSU has evolved into the International Science Council (ISC), created in 2018 after the merger of the International Council for Science (ICSU) and the International Social Science Council (ISSC). It is the only international non-governmental organization bringing together over 200 natural and social science unions along with national organizations, and the largest global science organization of its type. The IGY was exemplary in showing the way towards greater international scientific cooperation.

A final section of this IGY Bulletin article discusses plans for the USSR Rocket and Satellite Program during the IGY, which was submitted as a document to CSAGI. A total of 125 rocket launches for scientific measurements were projected. Satellite launches were expected, but no indication was given as to the number of satellites planned nor their launch dates. Just wait until October!

Friday, September 03, 2021

IGY Bulletin, Number 2, August 1957 - Rockets & Satellites: Radio Tracking System

Both the U.S. and the Soviet Union were expected to launch satellites during the IGY, so it was necessary to develop methods to track them. This article from the IGY Bulletin describes the Minitrack system developed by the Naval Research Laboratory to do that. I'll also use some supplementary material from a very useful Wikipedia article. (Much as I try to use alternate sources to sample other interesting and authoritative websites, Wikipedia truly is an amazing resource.)

The U.S. Naval Research Laboratory began operations in 1923, seven years after  Thomas Edison suggested that the Government establish “a great research laboratory.” NRL developed the first operational American radar, in time for use in World War II. It became a global leader in space science and development as a predecessor to the formation of NASA in 1958.

When plans for satellites emerged in the years preceding the IGY, the question naturally arose as to how to track them. Three approaches were considered: optical tracking, radar, and the NRL plan to measure angles using radio wave interferometry. The optical and radar approaches would work with a passive target, but had the major problem of finding the target in the first place, since they had very small fields of view. The NRL technique required a transmitter be placed on the target, but could easily measure a target anywhere in a wide field of view. The NRL proposal was accepted and turned into the basis of the Minitrack system.

The Minitrack transmitter that would send the signal from the satellite had a power level of about 0.05 watts. (A cell phone today emits on the order of one watt, 20 times greater.) The frequency of the signal was 108 cycles/second (hertz), or super/very low frequency.

The figure below from the Bulletin articles suggests how this system would work. Points A1 and A2 in figure 1(a) are two receiving antennas at the ground station. If the signals were arriving vertically, there would be no phase difference between the two sinusoidal waves; in other words, the distance P1-A2 would be zero. As the angle of the satellite tilts from the vertical (as shown in the figure), the length of this phase difference increases, and indicates the angle of the satellite from being straight overhead (the zenith). With two pairs of antennas perpendicular to each other, as shown in figure 1(b), two angles would determine completely the direction of the satellite from the antennas. 

IGY Bulletin,  #2, Fig. 1(a) and (b)  -Phase measurement in the Minitrack system

A so-called "picket fence" at longitude 75°W was to have eight stations spaced out in latitude so that the satellite would not be missed as it crossed that meridian. Two of the stations were in the U.S., two in the Caribbean, and four in South America. A photo of the station at Blossom Point, Maryland, is shown below.

Blossom Point Minitrack station (NRL)

I mentioned in an earlier post that, during my first "real" job with Fairchild Space and Electronics Company in Germantown, MD, I was involved in a couple of subcontracted projects with the NRL analyzing satellite power requirements for their satellites. One of these was for TIMATION-3, a satellite with technology that was a stepping stone to the development of GPS.

I still have that report from 1973! It was the first really substantial professional thing I helped write. The cover page, slightly weathered, was signed by my excellent group lead Doug Rusta and by me.  I generated hundreds of pages of tables and graphs for this report, many of which were hand written and plotted on graph paper, respectively.

Title page, report on the power subsystem for NRL's TIMATION III satellite

Hope you enjoyed today's physics lesson!

Thursday, September 02, 2021

IGY Bulletin, Number 2, August 1957 - World Days During IGY

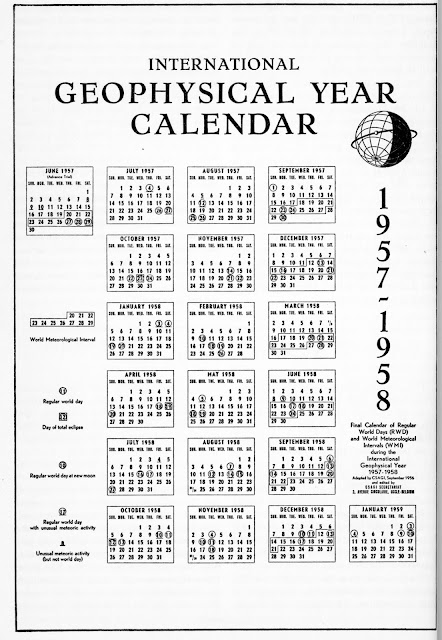
I am going to re-hash a little and add to what I said in an earlier post about the IGY calendar, because that is the subject of the second article in IGY Bulletin #2. (Anyway, a little review is appropriate before the IGY quiz I am thinking about administering.)

Recall that the IGY aimed, when appropriate and possible, to make synoptic (simultaneous, at different locations) measurements of geophysical phenomena across the globe, so that a snapshot in time could be taken for a particular phenomenon. The World Days program was established to enable even more intensive measurements during some periods of the IGY.

The article explains that there were three classes of days or periods during which special experiments or more intensive observations were made:

1. Regular World Days - three or four days each month, selected in advance. Two are consecutive days during new moon (e.g., 8/25-8/26/57 in the calendar below; others are at times of special meteor showers such as the Perseids, 8/12/57) or near one of the lunar quarter phases (e.g., 1st quarter, 7/4/57). RWDs also included total solar eclipses (e.g., 10/23/57) with adjacent days.

2. World Meteorological Intervals - series of 10 consecutive days, every three months, including a solstice or equinox (e.g., 9/18-9/27/57).

3. Special World Intervals - designated during the IGY when forecasts suggest high solar activity, such as the magnetic storm of February, 1958.

Calendar of special IGY days, from IGY Bulletin #2, August, 1957

By the way, if you haven't already noticed, most images that I include are shown enlarged in a new window if you click on them.

Wednesday, September 01, 2021

IGY Bulletin, Number 2, August 1957 - Status Report: Meteorology, Oceanography & Glaciology

Finally moving on to the SECOND issue of the IGY Bulletin, for August, 1957.

IGY Bulletin #2, August, 1957, p. 1

This issue is 15 pages, comprising five articles. You'll find my scan of the issue here.

The articles in this issue are:

  1. Status Report: Meteorology, Oceanography & Glaciology
  2. World Days During IGY
  3. Rockets & Satellites: Radio Tracking System
  4. CSAGI and the International Geophysical Year
  5. Antarctic Notes
The first article highlights three more areas of planned IGY studies, which I've again numbered according to the original list, and bulleted some of the key endeavors.

2. Meteorology objectives included:
  • studying major atmospheric circulation patterns, and latitudinal heat transfer
  • adding extra weather stations to improve global coverage, especially in the Arctic and Antarctic regions, by making measurements at the surface and at altitudes using balloons and aircraft
  • coordinating Antarctic measurements via the IGY Antarctic Weather Central at the Little America station
  • developing a pole-to-pole chain of meteorological stations in a longitude band between 70-80º W (passing through the eastern U.S.)
7. Glaciology objectives included:
  • investigating mass budgets of glaciers (accumulation vs. ablation), and mass and energy transfers between glaciers and their environments
  • calculating volumes of polar ice sheets and of sea ice, including seismic surveys to determine ice sheet thicknesses
  • determining patterns of regional climate variations and their historic patterns

8. Oceanography objectives included:

  • better understanding of three-dimensional oceanic circulation patterns via shipborne measurements at the surface and at depth
  • examining heat and water transfer between the oceans, atmosphere, cryosphere, and other components of the hydrosphere
  • improving information on sea level rise at various time scales, using many more observation points
  • installing observatories on more remote islands around the world, including drifting sea ice stations in the Arctic

These days we often use the rubric of Earth systems science to teach geosciences. The different "components" of the Earth system are interconnected in many and complex ways. These "spheres" include the geosphere (solid Earth), hydrosphere (water), cryosphere (ice), atmosphere, and biosphere. If you like, add the pedosphere (soil) and ionosphere/magnetosphere. We can roughly break down the 13 IGY areas of study into these "spheres" as follows:

  • geosphere - geomagnetism; longitudes and latitudes; seismology; gravity
  • hydrosphere - oceanography
  • cryosphere - glaciology
  • atmosphere - meteorology; nuclear radiation
  • biosphere
  • pedosphere
  • ionosphere/magnetosphere (and on into space) - aurora and airglow; geomagnetism (again); ionosphere; solar activity; cosmic rays; rockets and satellites
  • other - World Days and communications
This diagram suggests the complex interrelationships of the various "spheres":
The interaction of these spheres is an important part of contemporary climate science, and understanding climate change.