Showing posts with label science. Show all posts

Wednesday, November 23, 2022

Powers of Ten and Cosmic View

Powers of Ten is a short film made by the designer team of Charles and Ray Eames to illustrate the vast scale of the universe, from the outermost galaxies to the innermost nucleus of an atom, with human scale approximately in the middle. Starting from a look at picnickers on the shore of Lake Michigan, the scene zooms out by a factor of 10 every 10 seconds, from a scale of 1 meter (100) to a scale of 1024 meters. Then it zooms back to the picnic, and then inwards by a factor of 10 every 10 seconds until it reaches the nuclear scale of 
10-16 meters.

I saw a black-and-white predecessor of this film in my first-year physics course at Cornell in 1968, titled A Rough Sketch for a Proposed Film Dealing With the Powers of Ten. I was kind of blown away by it.

The best version of this film is this finished version of the Rough Sketch, now simply titled Powers of Ten, from 1977. The narration was by noted physicist and public intellectual Philip Morrison.

Other takes on the same theme include this 1996 version, also titled Powers of Ten, an IMAX film narrated by the omnipresent Morgan Freeman, starting on St. Mark's Square, Venice,

and this 1968 animated Cosmic Zoom from the National Film Board of Canada:

Every year I try to do a mini-celebration of Powers of Ten Day on Oct. 10, as I did again last month. When I worked in student life at Franklin & Marshall College in 2010, I organized a Powers of Ten event at 10:10 pm, on 10/10/10, with a showing of the film, or course.

This year I learned that these films emanate from a concept by Kees Boeke, as illustrated in his 1957 book, Cosmic View. Boeke, a Dutch reformist educator, Quaker missionary and pacifist, seems to have been a very interesting and committed individual. His idea for the scale of the universe theme was acknowledged in a couple of the films above.

You can see the pages of the Boeke's book Cosmic View at this website. Just as the Powers of Ten film was narrated by physicist Philip Morrison, this book includes an introduction by Nobel prize winner Arthur Compton. 

Jacket of Cosmic View (1957)

Is it coincidental that this book was published during the International Geophysical Year? At the dawn of the space age, I think that people had an increasing awareness and wonder at the scales of the universe, and it was certainly a challenge for educators to represent this.

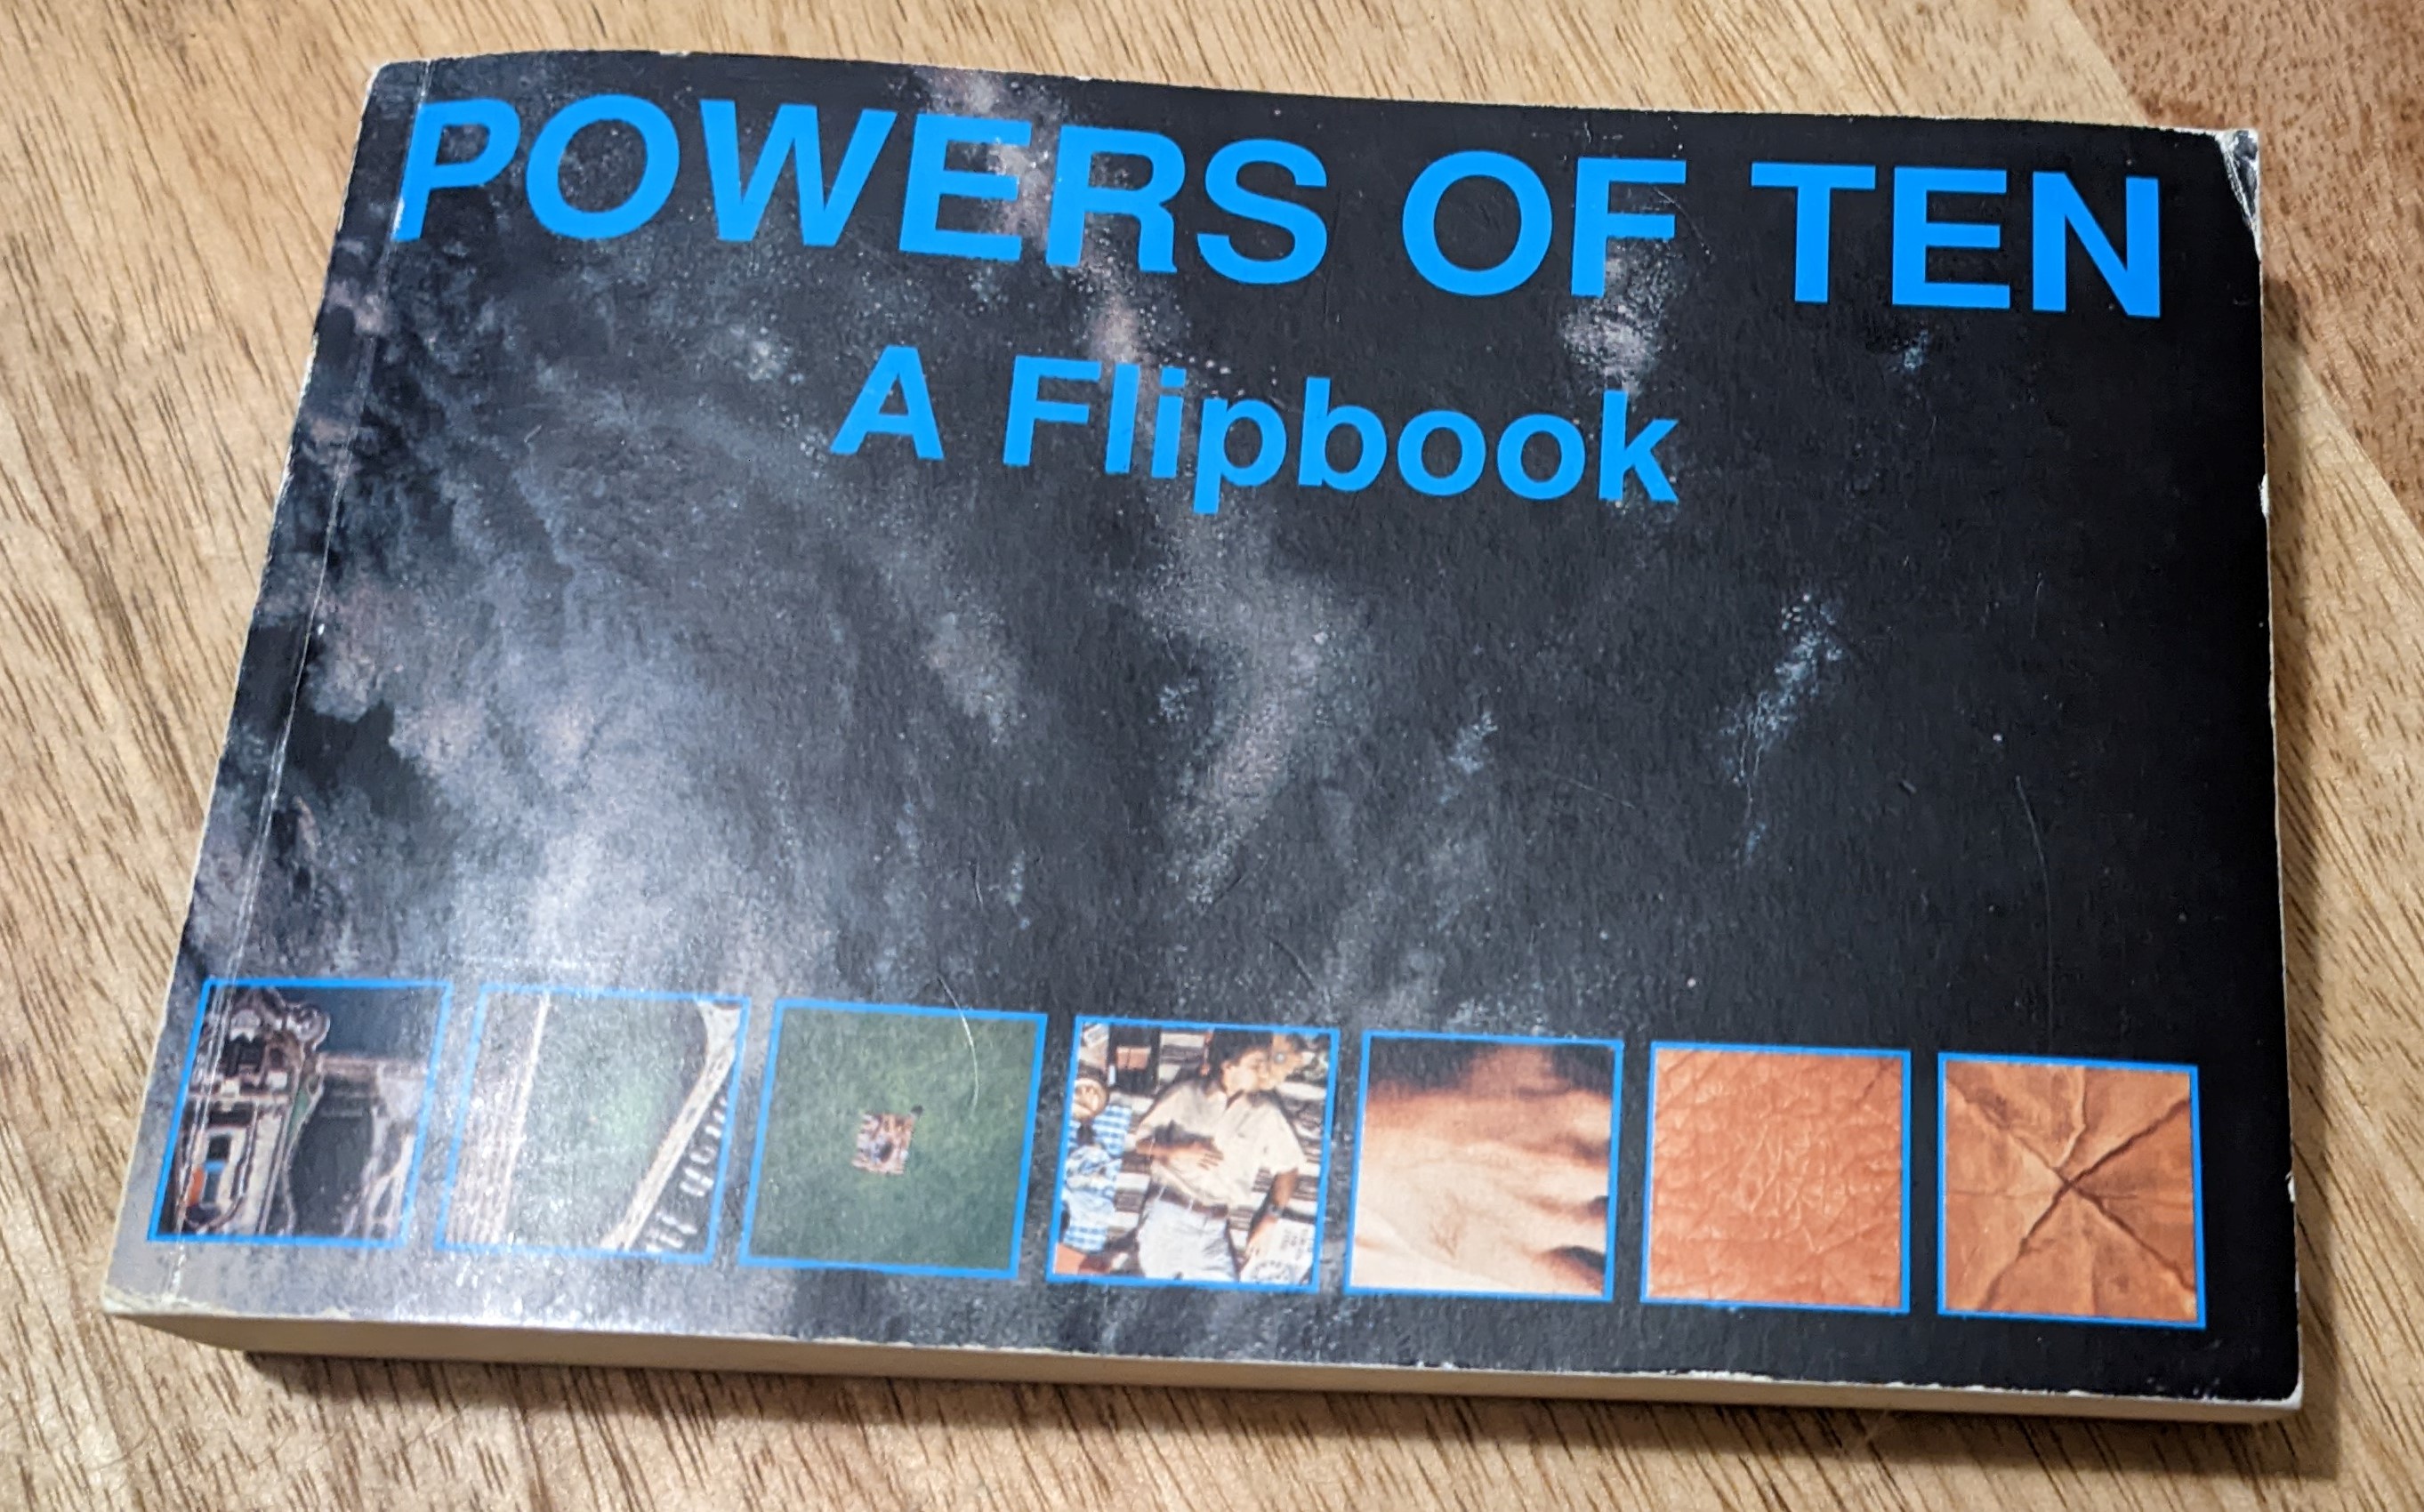
I have a couple of Eames souvenirs. There is a flipbook of Powers of Ten:
Then there is our Eames lounge chair and ottoman. It is an iconic piece of mid-century (20th) furniture, first released in 1956, just before the IGY. About 10 years ago, we bought this one, and despite needing a repair due to a design flaw with the aging epoxy, it suits us fine. The seller told us that our chair once belonged to 1984 VP candidate Geraldine Ferraro, although there is no proof of that.

And finally, the philatelic items. I have the 2008 sheet of 16 commemorative stamps showcasing the important contributions  of Charles and Ray Eames to American design. The Eames lounge chair is shown in one of the stamps., top row, second from left.

Charles and Ray Eames sheet, Scott catalog 4133

And I have a first day cover with the stamp of the chair and a corresponding cachet. 

Scott catalog stamp 4333f on a first day cover, canceled in Santa Monica on June 17, 2008 

The place of issue for these stamps was Santa Monica, California, where the Eames's had a house and studio. In 2014, I visited this Eames House in Santa Monica Canyon on a field trip outing during the International Symposium on Archaeometry held at the Getty Museum and UCLA in Los Angeles.

My photo of the exterior of the Eames House and Studio

Happy Thanksgiving, everyone.

Friday, April 22, 2022

Happy Earth Day; the International Biological Program

Today is Earth Day, first celebrated in 1970, when I was an undergraduate. One might draw a line from the IGY, the most ambitious attempt ever to study the Earth as a planet, to Earth Day a dozen years later. The nationwide events surrounding the first Earth Day were spurred by the Santa Barbara oil spill of 1969 and the growing concern about the vulnerability of Earth's natural systems to human impact.

The American Philatelic Society has a nice web page for today, on Earth Day StampsI'll have to double check if that is changed daily or regularly, in which case I will add it to my blog list in the sidebar. Earth Day stamps would be a nice collecting topic, surely one that has been done. I think I own one such stamp somewhere, but I can't find it. Searching on the colnect web site yields 155 Earth Day stamps.

In writing my last post about biological studies during the IGY, I came across a nicely complementary article on the International Biological Program (IBP):"Big science and big data in biology: from the International Geophysical Year through the International Biological Program to the Long Term Ecological Research (LTER) Network, 1957–Present"; Elena Aronova, Karen S. Baker and Naomi Oreskes; Historical Studies in the Natural Sciences , Vol. 40, No. 2, Spring 2010), pp. 183-224; available here if you have access to JSTOR

This very well written (so I will use direct quotes below) article was quite interesting in its discussion of "big science," the historical relationship between the IGY and the IBP, and the similarities and differences between these two programs. It states that 

"the Big Science of the IGY was distinguished by its emphasis on and the visibility of Big Data—a synoptic collection of observational data on a global geographic scale." 

It goes on to say that the 

"International Biological Program (IBP, 1964–1974), conceived shortly after the end of IGY, intended to emulate it by setting up a worldwide research initiative to accumulate a vast array of datasets on different living phenomena on a global scale, deploying standardized methods and interdisciplinary collaborations. The IBP is often referred to as one of the first realized Big Science projects in biology, and is often cited anecdotally as a biological version of the IGY."

As the Bulletin article covered in my last post also suggested, Aronova et al. state that 

"in contrast to the centralized worldwide coordination of the geophysical research initiatives during the IGY, the biological activities were without exception the result of individual initiative, with support coming from diverse sources." ... The "biological programs launched under the auspices of the IGY became the first testing ground for the planning of the IBP." 

The IBP came to focus on ecological studies whereby 

"the properties of the Earth were regarded as determined not only by the chemical and physical properties of the Earth but also by biological activities, which in turn were controlled, at least partially, by the physical properties of the environment." 

I like that systemic approach, including the feedback loops.

The IBP seems to have been less successful than the IGY. Not all biologists bought into the emphasis on ecology, a science which seemed more applied and "political" than other areas of biology. Programs were fragmented and idiosyncratic. Data were not centrally archived and shared as had happened for the IGY with the World Data Centers. And the hopes to construct synthetic models based on those data were unsuccessful. 

I was surprised to find that, in contrast to the IGY, only one stamp was issued for the International Biological Program. Maybe that is commensurate with the perceived lack of its success. 

I've just ordered a cover franked with that stamp:

International Biological Program first day cover with a block of Canada stamp 507 (1970)

The stamp shows a microscopic view of the inside of a leaf, not a great design in my opinion. The cachet on this cover showing the sun, soil, oceans, plants, land-based animals, and fish suggests the multifaceted nature of the Earth's biosphere, reminiscent of the interrelated Earth systems covered during the IGY. All these parts, in quasi-equilibrium, that people's actions have often thrown out of kilter. Let's be kind to Mother Earth.

Friday, January 28, 2022

Wave refraction, optical illusions, and the Titanic

One thing I like about physics is how the same math and physics principles can be used to understand a variety of different phenomena. In a recent post I briefly reviewed the use of refraction and reflection of seismic waves for learning about the layering of the sea floor. Other types of waves that can be refracted and reflected include sound waves, light (waves in the visible part of the electromagnetic spectrum), and other types of electromagnetic waves.

I came across two interesting articles in the last few days about wave phenomena that I wanted to mention. So let's call today's post just a little bit of (geo)physics, maybe because I am too lazy to dig into the next IGY Bulletin article.

The first article appeared Tuesday in The Guardian, one of three newspapers I look at every day and financially support. (The other two are the New York Times and the local Lancaster LNP.) The article was about a mysterious "iceberg" that appeared off the coast of Vancouver Island, a sighting that was surprising because it had not been otherwise noticed.

Simone Engels’s photograph of the apparent iceberg off the coast of Vancouver Island (The Guardian, 25 Jan. 2022)

The photographer Simone Engels was actually seeing the Cheam mountain range on the mainland of British Columbia, nearly 125 miles away, and below the horizon from where she was standing. This optical illusion was caused by what is known as a “superior mirage” which can occur when there is an atmospheric temperature inversion with a band of warm air resting on a layer of cold air. In such a situation, light rays from the source object are refracted (bent), projecting an image into the "wrong" position. The temperature boundary of the inversion represents a discontinuity in terms of light velocity, so the light waves are bent and seen to be at ground level even though the object actually lies below the horizon. 

Superior mirage of the "phantom iceberg" (The Weather Network)

The Italian term for such a superior mirage is Fata Morgana, and this video also explains and shows how it works:


This is the opposite of an "inferior mirage." For example, when you drive on a hot day and see mirage “puddles” on the pavement, that’s basically a repeated image of the sky that’s bent into a visible spot on the ground.

An article in the Smithsonian Magazine from 2012 that I came across described the hypothesis that a superior mirage led to the sinking of the Titanic in 1912 and the more than 1500 deaths that resulted. According to this idea, a thermal inversion and corresponding optical distortion camouflaged the presence of the looming iceberg to those on the Titanic until it was too late, and then distorted the distress signals that the Titanic sent out to the nearby freighter Californian after it was hit.

As for a stamp that shows seismic reflection and refraction, the former German Democratic Republic (aka GDR, East Germany, or Deutsche Demokratische Republik -- DDR -- auf Deutsch) issued a set of four geophysics stamps in 1980. These stamps are what philatelists call "se-tenant": two or more stamps of different colors, designs or values that are printed adjacent to each other on one sheet. (The American and Swedish sets on stamp collecting showed in my recent posts were also se-tenant.) The German 35-pfennig (pre-Euro) stamp (Scott #2145) shows seismic waves that are both reflected and refracted by layers in the geologic subsurface, used for reconnaissance exploration of oil and natural gas deposits.

Cover from my collection showing GDR Scott block #2146a, including stamps #2143-2146, on the topic of geophysical exploration

Monday, December 20, 2021

IGY Bulletin, Number 6, December 1957 - Oceanographic island observatory in Iceland

The article starts by reminding us that one of the goals of the US-IGY oceanography program was a worldwide study of sea level in an effort to understand a seasonal cycle of mass deficiency between the northern and southern oceans. (These terms were general, although the Southern Ocean is now the 'newest' named ocean, recognized by the U.S. Board on Geographic Names as the body of water extending from the coast of Antarctica to the line of latitude at 60°S.)

The major objective of the IGY sea level program was to obtain more reliable measurements for the values of mean sea level. At that time there were about 500 tide gauges around the world. Distribution of these stations was uneven, so more than 200 new stations were established for the IGY as part of the Island Observatory Program, with an emphasis on island stations and the southern hemisphere coastlines.

So many stations are useful because sea level rise has a global and a local component, as pointed out here by NOAA, so the geographically diverse measurements can be used to disentangle those effects.

The article mentions that a complication for the station in Grindavik, Iceland, was the 12 foot variation in daily sea level due to the tides, similar to the infamous 50' tidal variation for the Bay of Fundy. Wow, I didn't realize I was so close to there when I went to Acadia National Park in September.

Th tidal gauge record from Reykjavik, Iceland (below) below is graphed from the IGY era to the present, showing the linear trend of 2.35 mm/year as well as monthly fluctuations.

Reykjavik tidal gauge for the last 40 years

The article also states that it is difficult to separate the effects of global sea level change due to thermal expansion of ocean water and due to addition of extra water to the ocean basins, so temperature profiles of the ocean water were collected at stations to depths of 1000'. Rising global temperatures will cause thermal expansion of ocean water, and also cause glaciers to melt and feed more water into the ocean basins.

This NOAA map shows the distribution of tide gauges around the U.S. These each record local relative sea level (RSL) trends, a combination of "eustatic" (global) sea level rise and the local vertical land motion. The global sea level trend has been recorded by satellite altimeters since 1992. Global sea level rose at a rate of about 1.7 mm/year during the 20th century (NOAA), but 3 mm/year since 1992 (NOAA). This latter rate would lead to an additional increase of 10" by the end of this century.

The tides are due to the gravitational attractions of the Moon and Sun, the former being twice as great as the latter due to the Moon's closer distance to Earth. NASA explains the tides with some helpful animations. Not only is sea level affected by tides with a diurnal or semi-diurnal (or mixed) periodicity as the Earth rotates beneath the Moon, but so is the solid Earth.

By the way, my second summer job, in 1970, was with the U.S. Weather Bureau in Silver Spring, Maryland. The Weather Bureau had become part of the Environmental Science Services Administration when that agency was formed in 1966. The Environmental Science Services Administration was renamed the National Oceanic and Atmospheric Administration (NOAA) on October 1, 1970 (soon after I worked there), with the enactment of the historic National Environmental Policy Act. At that time, the Weather Bureau became the National Weather Service.

I remember my work there as not being very instructive or productive, because I had few useful responsibilities. A couple of the older chaps (and I think all the scientists were men) were a bit hostile to me because of my long hair and presumed (and correctly so) liberal political persuasion. I did have an ongoing discussion with one of the fellows, Red, which left our opinions mostly unchanged but at least left us sharing mutual respect for each other as generally friendly and thoughtful individuals.

Wednesday, December 15, 2021

IGY Bulletin, Number 6, December 1957 - Volunteer participation in the IGY Earth Satellite Program

We move on to issue #6 of the IGY Bulletin, from December, 1957. A pdf of this issue (following the Nov. issue), downloaded from the Transactions of the American Geophysical Union, can be found here. This 16-page issue consists of the following articles:

  1. Volunteer participation in the IGY Earth Satellite Program
  2. Moonwatch observing methods
  3. Whistlers and related phenomena
  4. Arctic Ocean submarine ridges
  5. Oceanographic island observatory in Iceland
  6. Second Soviet satellite

In this post, I will review the first article, Volunteer participation in the IGY Earth Satellite Program

The launching of Sputnik on October 4, 1957, highlighted the value of volunteer efforts across the world for satellite tracking. The programs below were to be used for observing both U.S. and Soviet satellites.

The article lists four ways in which volunteers could contribute to the IGY Earth Satellite Program:

a) forming visual observation teams using simple optical instruments. These teams were organized by a special program of the Smithsonian Astrophysical Observatory, named Moonwatch (a former colleague of mine from the F&M astronomy program has a comment after the linked article). At the time of this Bulletin, over 100 such teams had been organized across the U.S., and 62 outside the U.S. It was reported that the Soviet Union had itself organized 66 such stations.

A simple (!) Moonwatch telescope used a mirror to reflect skylight upward into the objective, an arrangement that observing the sky comfortably for hours at a time. 

Moonwatch "telescope array" (Air Force Historical Research Agency)

b) establishing radio tracking stations in coordination with amateur radio clubs, universities, or other scientific groups. This effort was organized under a program called Moonbeam, a secondary network of less elaborate stations run by volunteers to complement the primary Minitrack stations mentioned in an earlier post. Moonbean enabled amateur radio operators to build a simplified version of the Naval Research Laboratory tracking stations for about $5,000 using a “Mark II” system (NASA).

c) recording telemetry signals of scientific data transmitted from satellites by radio and forwarding them to IGY centers. This was done by the same instruments that were used to do radio tracking of the satellites (b).

d) photographing satellite passages across the background star field by means of high quality cameras. A program for this has not yet been formed at the time of the article, but preliminary efforts of te Society of Photographic Scientists and Engineers (renamed in 1992 as the Society for Imaging Science and Technology) had been endorsed.

These efforts would today be termed examples of citizen science. The National Park Service describes citizen science as “when the public voluntarily helps conduct scientific research. Citizen scientists may design experiments, collect data, analyze results, and solve problems. In national parks, most citizen scientists collect data with tools provided by project directors. These data help professional scientists and resource managers answer scientific questions and solve important problems. And the activity helps participants build meaningful connections to science."

The North Museum of Nature and Science, across the street from my house in Lancaster, Pennsylvania, provides opportunities to participate in a citizen science project on plant phenology.

I used the collecting website colnect to search for stamps with the phrase "citizen science." It brought up a set of four Australian stamps commemorating citizen science that were issued last year. I don't own these stamps, but I include depictions and descriptions of them below.


Saturday, November 20, 2021

IGY Bulletin, Number 5, November 1957 - South pole winter weather review

Two nights ago I had a couple of peeks at the lunar eclipse. For once my insomnia had a benefit. The eclipse was notable for its reddish color and duration, the longest eclipse in over 1,000 years. If you didn't see it, this compilation of astro photos (with musical accompaniment, unfortunately) spanning the entire duration might satisfy you:

I was thinking that the mathematically beautiful predictability of such events is awesome, especially in these times that are uncertain in so many other ways.

Another characteristic of the Earth's orbit about the sun is how it generates seasons. Northern hemisphere winter actually occurs when the Earth is closest to the sun, so distance from the sun cannot be the cause of seasons. (My editor was surprised that orbits -- whether planetary or of satellites -- are elliptical, with a circular orbit being only a special case. This video explains with a modicum of qualitative physics why orbits are elliptical.) Furthermore, seasons are reversed in the northern and southern hemispheres. These facts can be explained by the fact that seasons are due to the tilt of the Earth's orbit

Reasons for the seasons (NASA)

So while we are getting lovely fall colors as shown in these recent neighborhood photos, it's now Spring in the southern hemisphere.


All this is a lead-in to the IGY Bulletin article on the South Pole winter weather review, from about June 20 - September 20, 1957. Most of this was within the official beginning portion of the IGY, which started on July 1, 1957. The article states that
A new [global] record low temperature of -102.1°F was measured at the Amundsen-Scott South Pole Station on September 17, 1957. This eclipses [no pun intended] the previous low of -100.4°F, which occurred on May 11 of this year.
The article continues that the previous record cold temperature of -90°F was set in Siberia in 1933. It also points out that the North pole is unlikely to see temperatures below -50°F because the Artic is an ocean covered with ice, as opposed to continental Antarctica. Water has a higher specific heat (i.e., temperatures respond to heat changes more sluggishly) than land, so temperature extremes on coasts and over an ocean are mitigated. In fact, the lowest temperature recorded in the northern hemisphere was not at the North Pole (in the midst of the Arctic Ocean) but over the landmass of Greenland, -93.3°F (-69.6 °C), on Dec. 22, 1991.

The lowest temperature since recorded at the Amundsen-Scott South Pole Station was -117.0°F (−82.8°C) on June 23, 1982.

The Bulletin article predicted that lower temperatures would likely be found further in the interior of Antarctica, nearer the Pole of Inaccessibility, which is further from the surrounding oceans than is the South Pole (see map in this previous post). The Soviet Union established a now-abandoned research station there later in the IGY. Wikipedia's page of weather records lists the now lowest recorded temperature of -128.6°F (-89.2°C) at another Russian Antarctic station, Vostok Station, on July 21, 1983. An even colder temperature of -136°F (-93.2°C) was inferred from remotely sensed measurements by satellites over the East Antarctic Plateau on Aug. 10, 2010.

The average winter temperature in 2021 at the Amundsen-Scott South Pole Station was -78°F (-61°C),  the coldest on record (even though there was not a new record for the single coldest day). Note that the graph below from an article in the Washington Post shows that the oldest data in this series dates to the IGY in 1957.

Average winter temperature at the South Pole since 1957 in °C (Richard Cullather/British Antarctic Survey)

Darn, all this is making me think of the approaching winter. Brrr.

Friday, September 17, 2021

IGY Bulletin, Number 3, September 1957 - Status Report: The Upper Atmosphere Program

Finally moving on to the September 1957 (64 years ago, almost senior citizen status) issue of the IGY Bulletin. I have posted this Bulletin as a pdf downloaded from the AGU archive of the Transactions, American Geophysical Union, vol. 38, #5, October, 1957.

This issue is 16 pages, comprising seven articles. The articles in this issue are listed below. The numbers in parentheses refer to the sub-disciplines covered by the IGY, as discussed in a previous post.

1. Status Report: The Upper Atmosphere Program (an introduction to the following articles)

2. Solar Activity Program (#6)

3. Cosmic Ray Program (#7)

4. Geomagnetism Program (#2)

5. Ionospheric Physics Program (#5)

6. Aurora and Airglow Program (#4)

7. Rocket Program (#11)

The short Status Report article, the topic of this post, explains that the next six articles deal with the various US-IGY programs in each of the atmosphere disciplines, with the final related section on the rocketry program.

The sun is of central importance in the high atmosphere. Its radiation causes ionization and chemical processes in the upper atmosphere. Disturbed solar conditions affect the ionosphere and radio communications, and often cause auroral, geomagnetic, and cosmic ray activity.

In a previous post, I included a diagram showing the stratification of the Earth's atmosphere. The atmosphere refers specifically to the layers of gas surrounding any planet, and their properties. The ionosphere is the ionized part of Earth's upper atmosphere, stretching from a height of about 50 km (30 mi) to more than 1,000 km (600 mi). It includes the atmospheric layers of the entire thermosphere and parts of the mesosphere and exosphere. Ionized by solar radiation, the ionosphere plays an important role in atmospheric electricity and forms the inner edge of the magnetosphere, the envelope containing the Earth's magnetic field. Airglow occurs when atoms and molecules in the upper atmosphere, excited by sunlight, emit light. This phenomenon is somewhat similar to auroras, which are driven by high-energy particles originating from the solar wind.

Atmosphere layers on left; ionosphere layers on right; phenomena and means of measurement in the center (NASA). Click on image to enlarge.

Friday, September 10, 2021

IGY Bulletin, Number 2, August 1957 - CSAGI and the International Geophysical Year

Ok, just this and one more short article to review from this second issue of the IGY Bulletin.

Remember that the words after the dash in the title of this post is the name of the article I am summarizing. So what is CSAGI? CSAGI is the acronym for Comité Spécial de l'Anée Géophysique Internationale, French for The Special Committee for the International Geophysical Year. This group was formed by the International Council for Scientific Unions (ICSU) to develop and coordinate the IGY. CSAGI met for the first time in October, 1952, almost 5 years before the start of the IGY, and organized a number of meetings after that to coordinate the various national committees working on the different subdisciplines of the IGY.

The officers of CSAGI were the following:
Sydney Chapman, President - bio
Lloyd V. Berkner, Vice President - bio
Marcel Nicolet, Secretary-General - bio
V. V. Beloussov - bio
Jean Coulomb - bio

I recently purchased an IGY first day cover signed by Sydney Chapman, one of the most accomplished geophysicists of the 20th century and a primary driving forces behind the IGY. This was one of my more expensive covers, but I had been searching for one signed by him so considered myself fortunate to find it.

US #215 in my IGY FDC collection

I don't think too much about possible forgeries in the philatelic items I buy, but one has to at leas contemplate that for more expensive items. Fortunately, Chapman's signature came with a certificate of authenticity, which I have chosen to trust.


The article also lists representatives to CSAGI from eight major international scientific societies, and reporters for each of the major geophysical subdisciplines covered by the IGY.

The article announced that Pergamon Press would be publishing 4-6 volumes of the Annals of the International Geophysical Year in 1957 and 1958, constituting a central record of IGY activity, proceedings, and technical manuals. Eventually, as best I can tell, 48 volumes were published from 1959-1970. One archive of the Annals is at the American Philosophical Society library in Philadelphia, only a train ride away for me, so before long I'll have to go have a look.

The Bulletin article also outlines the formation of the World Data Centers, organized to collate the data collected during the IGY from over 2000 stations by 10,000 scientists from over 60 countries. At the time, World Data Center A was the responsibility of the U.S., World Data Center B was set up in the Soviet Union, and World Data Center C was dispersed through Western Europe and the Pacific. The World Data Centers still exist today, as the World Data System.

Since the IGY, the ICSU has evolved into the International Science Council (ISC), created in 2018 after the merger of the International Council for Science (ICSU) and the International Social Science Council (ISSC). It is the only international non-governmental organization bringing together over 200 natural and social science unions along with national organizations, and the largest global science organization of its type. The IGY was exemplary in showing the way towards greater international scientific cooperation.

A final section of this IGY Bulletin article discusses plans for the USSR Rocket and Satellite Program during the IGY, which was submitted as a document to CSAGI. A total of 125 rocket launches for scientific measurements were projected. Satellite launches were expected, but no indication was given as to the number of satellites planned nor their launch dates. Just wait until October!

Friday, August 27, 2021

It IS rocket science

After the last post on rockets and space, I thought I would trot out a couple of my memorabilia items. First is a book that came out during the IGY to tout the U.S. IGY satellite program. It was written by the prolific polymath and popular science writer Willie Ley, published in 1957 by General Mills. I wonder if this had anything to do with GM's biological warfare programs? Holy (holey) Cheerios! The 44-page book discusses plans to launch at least six Vanguard three-stage rockets during the IGY, carrying satellites as payloads. Unlike other noted rocket scientists, Ley was appalled by the rise of the Nazis and left Germany in 1935.


Ley had become interested in spaceflight after reading German rocket pioneer Hermann Oberth's book about spaceflight. Oberth was one of three early 20th century rocket flight visionaries, along with American Robert Goddard and Russian Konstantin Tsiolkovsky.

I have two commemorative postcards that with cachets by the Hermann Oberth Society. That Society has since merged with others to become part of the German Society for Air and Space Travel. The stamp on each card is the Federal Republic of Germany (West Germany) 1961 15-pfennig stamp portraying Martin Luther, Scott catalog Germany #828. Both cancellations are dated June 26, 1964, from Darmstadt, for the 13th Rocket and Space Travel Days. The top cachet depicts NASA's Project Gemini (1962-66), and the other honors Project Apollo (1961-72). 


I've previously showed you a 1964 first day cover with the Robert Goddard stamp that I collected in my youth. I also have two Soviet stamps of Konstantin Tsiolkovsky. The first is the 40-kopeck Scott catalog #1991 (Russia, 40), issued on Oct. 7, 1957, just three days after the launch of Sputnik 1. I assume this stamp was waiting in the wings pending the Soviets' first satellite launch, since it does not commemorate an anniversary date of Tsiolkovsky's birth or death. 


With a little more prep time, the USSR issued a stamp on Nov. 28 1957 (Scott #2021), with the same design, and an overprint which translates as "Oct 4, 1957 - First artificial satellite in the world." The bragging rights were duly earned.


If you want to see even an older space movie than First Man Into Space (last post) about extraterrestrial travel, how about Frau im Mond (Woman in the Moon, 1929)? Directed by Fritz Lang (Metropolis, M), it was an early sci-fi silent epic, just as the movies were adding sound. Parts are impressive, parts are silly by today's (or my) standards. Shaving an hour off the 2:50 run time would have made this story a bit tighter. Yet there was some decent rocketry stuff in the film, due to credited assistance from Hermann Oberth, and (according to Wikipedia) an even more substantial but uncredited input from Willy Ley.

I used to launch Estes model rockets with my sons, which became the basis for a couple of science fair projects. I also used rockets for some enrichment activities on the laws of motion with high school student gifted programs. Hmm, maybe I should do another countdown?

Son Max on the launch pad with his 6th grade science fair project, 1995

Blastoff!

Thursday, July 15, 2021

My first philatelic exhibit: international IGY stamps

Philatelic exhibiting is a way of formally presenting part of one's collection at stamp expos that is akin to poster presentations at academic meetings. There are different types of exhibits, which are judged at larger philatelic expositions according to rather detailed and sometimes arcane guidelines.

A few years ago I even took a summer seminar on exhibiting at the American Philatelic Society just up the road in Bellefonte, PA. I realized I probably had the stuff, potential themes, and the ability for exhibiting, but I wasn't that keen on the formality, competitiveness, and judging vagaries of the process. I decided in the end on this blog as a different and less rule-bound way to present some of my collection and my related and sometimes unrelated thoughts.

Nonetheless, I decided to submit a short exhibit for the American Topical Association's one-page exhibit show. I mean, it was just one page, online, and unjudged, so it is a rather low stakes way to get some sense of the exhibiting experience. And sure enough, coming up with a theme gave me another way to look at my collection. I delved into my international IGY stamps more than I have so far in this blog. I knew that many countries that participated in the IGY never issued IGY stamps; that some countries that came out with rather attractive stamps were not necessarily the most active IGY participants; and that not all of the IGY stamps were actually issued during the IGY itself. So my result is this pdf, also shown below. I opted to show at least one stamp from each of the 19 countries I counted that actually issued one or more IGY stamps during the IGY period (not later, or on anniversaries), and noting the themes of the stamps. It was hard to cram 19 stamps onto one 8.5"x11" page, so the font is small, the margins are wide, and elements are crowded. So although the design is not ideal, I made it work in two days of off-and-on work. This will help me think about my collection in some different ways.


I'll have more to say about IGY countries another time.

Thursday, May 20, 2021

Geophysics in the news - a solar coronal mass ejection

I happened to run into this geophysical story in the news today.

NASA's Solar Orbiter launched on February 10, 2020, and is currently in the cruise phase ahead of the main science mission, which begins in November of this year. This mission has already detected and tracked the evolution of a coronal mass ejection (CME) on February 12-13, 2021. CMEs are eruptions of particles from the solar atmosphere that blast out into the Solar System, and are responsible for space weather phenomena in the near-Earth environment. Understanding the sun and its relationship to the Earth was one of the major areas of study during the IGY.

CMEs, first identified as such in 1971, are often related to solar flares and prominences, such as shown on the U.S. IGY stamp (see the cover image below).

Here is a beautiful simulation of a CME interacting with the Earth's magnetosphere.


One of the most impressive solar storms in history was the 1859 Carrington event, since identified as a CME. This was almost 100 years before the IGY. The storm caused strong auroral displays and wrought havoc with telegraph systems. A solar storm of this magnitude occurring today would cause widespread electrical disruptions, blackouts, and extended outages of the electrical grid. So knowledge about extreme solar events has useful technological implications.

Currently we are just past the solar minimum between solar cycles 24 and 25. During solar minima, CMEs are less frequent, but still occur.

https://www.swpc.noaa.gov/products/solar-cycle-progression

I mentioned the International Year of the Quiet Sun (IQSY) in my post of Feb. 22. That year of scientific study around solar minimum complemented the solar research during the IGY and a solar maximum. 

My IGY philately colleague Bob Greenwald recently alerted me to the solar science Forever stamp series that will be issued this year.  If you click on and enlarge the image below, you'll notice the stamps showing coronal holes and coronal loops.

U.S. sun science Forever stamps to be issued in 2021

Below is a 1964 cover, produced by the Rocket Research Institute, from my collection (US 169, my index #). One stamp is the 3¢ 1958 IGY stamp. The other 5¢ 1963 stamp is US #1237, comemmorating the centennial of the founding of the National Academy of Sciences. The cover honors the 5th anniversary of the IGY, and the contemporaneous IQSY. The postage of 8¢ was the airmail rate from 1963-1968. The cachet includes logos for both the IGY and the IQSY. The insert is a graphic of John C. Fremont's encampment on Pyramid Lake (near Reno, the city where the stamp was postmarked), over which the rocket carrying this cover was flown.

IGY-IQSY cover (1964), front

IGY-IQSY cover, back

IGY-IQSY cover, insert

Elon Musk - rocket mail?

Thursday, April 22, 2021

Earth Day, the Keeling Curve, and the IGY

Today has been Earth Day.

I remember the first Earth Day in 1970. Many of us who consider ourselves "environmentalists" today were a little unsure at the time if the promulgation of Earth Day might have been an attempt to distract us from the Vietnam War. Nowadays, I realize that concern for the sustainability of  Earth systems, and for peace, social and environmental justice for its inhabitants are not mutually exclusive.

Ben Goossen is a historian at Harvard University whose current book project, “The Year of the Earth (1957-1958): Cold War Science and the Making of Planetary Consciousness,” offers a global history of the International Geophysical Year. At his website, you can download his very interesting article, "A benchmark for the environment: big science and 'artificial' geophysics in the global 1950s" (Journal of Global History, 15:1, 149-168, 2020). (As a geophysicist, for reasons I may return to, I'm not so keen on his use of the term artificial.) Among so much content in this article, Goossen discusses the importance of the IGY in forging global perspectives of Earth systems science and the environment. In particular, he mentions the groundbreaking work, started during the IGY, of Scripps Institution of Oceanography scientist Charles Keelingwhose program of carbon dioxide measurements in the atmosphere was perhaps one of the most significant endeavors of the IGY.

In this 2008 video, Keeling describes his early work and its relationship to the IGY:

I think my friend John and I made a manometer together in 9th grade (?) science class, but we fudged the procedures to maximize our chances for a successful class demonstration.

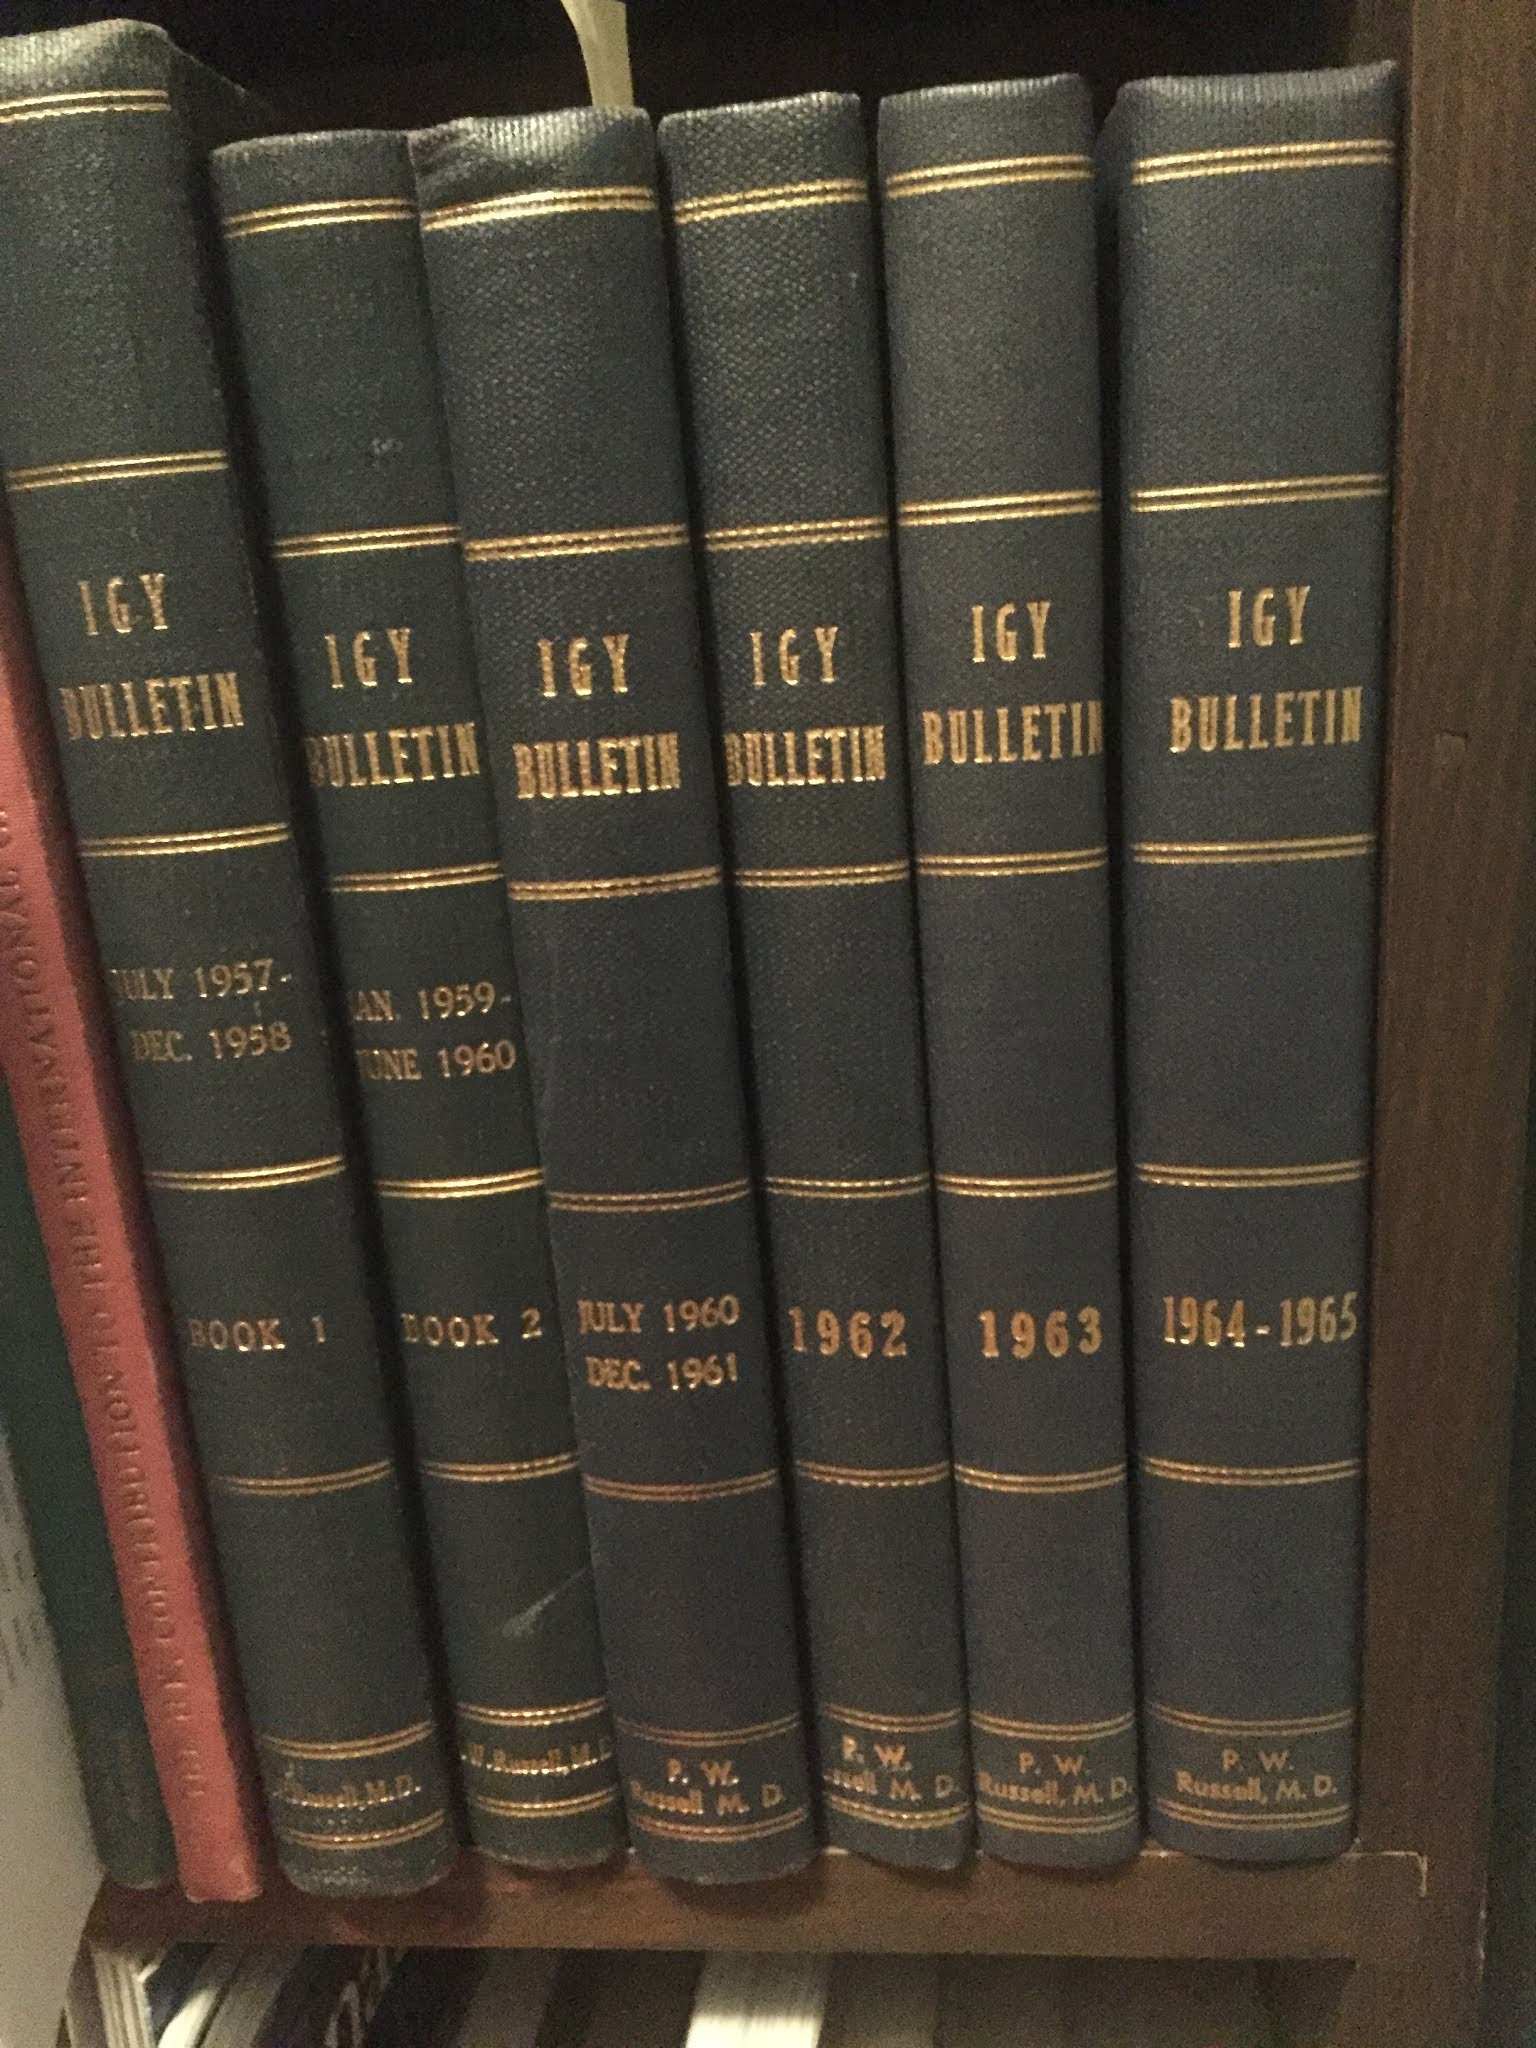
My bound set of IGY Bulletins
I own a complete set of the IGY Bulletins, monthly surveys of programs of the IGY and the subsequent International Geophysical Cooperation-1959 as related primarily to U.S. programs. A total of 96 issues came out between 1957 and 1965.

Keeling's first set of results are in issue #38, Aug. 1960, p. 8-11. I have scanned it as a pdf (sorry about the edge effects of the bound volume).

Three figures from this paper are worth showing below. Keeling was on the way to establishing one of many synoptic data sets collected during the IGY, with simultaneous measurements made at multiple stations around the world to better establish global patterns.

Measurements from the more vegetated temperate regions of the northern hemisphere were already showing a seasonal carbon dioxide respiration pattern.

Measurements from the unvegetated Antarctic region were already showing a small but steady carbon dioxide increase over time due to the burning of fossil fuels.

Now, with considerably more data, this animation from NOAA 

clearly shows these patterns of historic increase in atmospheric carbon dioxide, aka the iconic Keeling curve. As the animation begins in 1980, you can see the seasonal oscillation of about 5 ppm (parts per million) in the northern hemisphere due to vegetation changes, and the long-term increase of about 2 ppm/year at both Mauna Loa, Hawaii, and in Antarctica (no regional vegetation, so little seasonal change), due largely to the burning of fossil fuel. The older, post-IGY, Keeling data show up in green after the animation reaches the year 2014, followed by even older results in orange that were derived from measurements of carbon dioxide extracted from pores in dated layers of glacial ice from Antarctica ice cores. The CO2 concentration has increased from a pre-industrial level of about 280 ppm to a 1958 level of 315 ppm to over 400 ppm today, a rise of about 30% since the IGY! 

This clip from the American Museum of Natural History reviews the development of the Keeling curve. As shown at the end, what policies we follow in the near future will profoundly determine levels of atmospheric carbon dioxide reached by the end of the current century.


As this animation shows, the mean global temperature has risen in a highly correlated way with CO2 increases


This is in general theoretical accordance with greenhouse effect predictions made already in the late 1800s by the Swedish Nobel Prize winning chemist Svante Arrhenius.

 Data and data visualization can be beautiful, even if the inferences drawn may be sobering.