Monday, December 20, 2021

IGY Bulletin, Number 6, December 1957 - Oceanographic island observatory in Iceland

The article starts by reminding us that one of the goals of the US-IGY oceanography program was a worldwide study of sea level in an effort to understand a seasonal cycle of mass deficiency between the northern and southern oceans. (These terms were general, although the Southern Ocean is now the 'newest' named ocean, recognized by the U.S. Board on Geographic Names as the body of water extending from the coast of Antarctica to the line of latitude at 60°S.)

The major objective of the IGY sea level program was to obtain more reliable measurements for the values of mean sea level. At that time there were about 500 tide gauges around the world. Distribution of these stations was uneven, so more than 200 new stations were established for the IGY as part of the Island Observatory Program, with an emphasis on island stations and the southern hemisphere coastlines.

So many stations are useful because sea level rise has a global and a local component, as pointed out here by NOAA, so the geographically diverse measurements can be used to disentangle those effects.

The article mentions that a complication for the station in Grindavik, Iceland, was the 12 foot variation in daily sea level due to the tides, similar to the infamous 50' tidal variation for the Bay of Fundy. Wow, I didn't realize I was so close to there when I went to Acadia National Park in September.

Th tidal gauge record from Reykjavik, Iceland (below) below is graphed from the IGY era to the present, showing the linear trend of 2.35 mm/year as well as monthly fluctuations.

Reykjavik tidal gauge for the last 40 years

The article also states that it is difficult to separate the effects of global sea level change due to thermal expansion of ocean water and due to addition of extra water to the ocean basins, so temperature profiles of the ocean water were collected at stations to depths of 1000'. Rising global temperatures will cause thermal expansion of ocean water, and also cause glaciers to melt and feed more water into the ocean basins.

This NOAA map shows the distribution of tide gauges around the U.S. These each record local relative sea level (RSL) trends, a combination of "eustatic" (global) sea level rise and the local vertical land motion. The global sea level trend has been recorded by satellite altimeters since 1992. Global sea level rose at a rate of about 1.7 mm/year during the 20th century (NOAA), but 3 mm/year since 1992 (NOAA). This latter rate would lead to an additional increase of 10" by the end of this century.

The tides are due to the gravitational attractions of the Moon and Sun, the former being twice as great as the latter due to the Moon's closer distance to Earth. NASA explains the tides with some helpful animations. Not only is sea level affected by tides with a diurnal or semi-diurnal (or mixed) periodicity as the Earth rotates beneath the Moon, but so is the solid Earth.

By the way, my second summer job, in 1970, was with the U.S. Weather Bureau in Silver Spring, Maryland. The Weather Bureau had become part of the Environmental Science Services Administration when that agency was formed in 1966. The Environmental Science Services Administration was renamed the National Oceanic and Atmospheric Administration (NOAA) on October 1, 1970 (soon after I worked there), with the enactment of the historic National Environmental Policy Act. At that time, the Weather Bureau became the National Weather Service.

I remember my work there as not being very instructive or productive, because I had few useful responsibilities. A couple of the older chaps (and I think all the scientists were men) were a bit hostile to me because of my long hair and presumed (and correctly so) liberal political persuasion. I did have an ongoing discussion with one of the fellows, Red, which left our opinions mostly unchanged but at least left us sharing mutual respect for each other as generally friendly and thoughtful individuals.

Sunday, December 19, 2021

IGY Bulletin, Number 6, December 1957 - Arctic Ocean submarine ridges

I'm hoping to push through the December 1957 issue of the IGY Bulletin before I start some holiday travel later this week. I know, not the best time to go traveling, but planning was made before Omicron came along, and everyone in the party is fully vaccinated and boosted. So crossing my fingers (and being as careful as I can) on this one.

First, some back ground on ocean ridges, the theme of this article. The bathymetric mapping of the sea floor took off in the late 1800s, first with soundings by lowering weighted lines to the sea bottom, then by sonar in the 1920s, and then by multibeam and sidescan sonar in the 1960s. Bruce Heezen and Marie Tharp's Physiographic Map of the North Atlantic in 1957, the year of the IGY, was the first map that enabled the general public to visualize what the ocean floor really looked like. Twenty years later they produced the first complete world map of the ocean floors.

Heezen and Tarp map of the sea floor, 1977 (Lamont-Doherty Earth Observatory)

Marie Tharp's contributions were downplayed early in her career due to the sexism prevalent in the Earth sciences. Belatedly, Tharp became recognized for her accomplishments. Twenty years further on, in 1997, the Library of Congress named her as one of the four greatest cartographers of the 20th century. 

The diagram below illustrates major features of the sea floor. There is no scale in this schematic illustration, but the Mid-Atlantic Ridge system rises about 3 km above the ocean floor, and is 1000-1500 km wide.

Major features of the sea floor (University of Puerto Rico)

Understanding the origin of the mid-ocean ridges became key to the theory of sea-floor spreading in the early 1960s, which in turn became incorporated into the theory of plate tectonics later that decade. 

The IGY Bulletin article starts with:

On August 12, 1957, geophysicists on IGY Drifting Station A, in the Arctic Ocean, reported that the ice floe on which the station is established had floated over a submarine ridge, or mountain range, rising more than 5000 feet above the ocean floor.

The ridge was inferred from a series of 13 seismic depth soundings (yielding shorter echo times from the elevated ridge for the seismic waves) and gravity measurements (higher values due to rock in the ridge displacing lower density ocean water). The fact that the ridge feature could be observed over several days of drifting suggested that it was fairly extensive.

From the IGY Bulletin article

The article stated that the topographic extent of the discovered feature (shown by the series of dots left of center in the above figure) was uncertain, but it seemed to parallel a previously known feature, the Lomonosov Ridge (discovered in 1948, and now the focus of an important geopolitical dispute).

By comparing with the contemporary map of the Arctic sea floor below, and as also stated in this article, the feature discovered in 1957 was what is now recognized as Alpha Ridge.

Arctic Ocean seafloor features map. Note the orientation is not the same as for the preceding map.

The Bulletin article continues by discussing the implications of sea floor bathymetry for better understanding water circulation in the Arctic Ocean.

In prepping for this post, I bought the only stamp I could find showing a mid-ocean ridge, from Ascension island. It has its own listings in the Scott catalogs, but is part of the British Crown Colony of St. Helena. As the map on the stamp shows, Ascension as well as St. Helena are on the Mid-Atlantic Ridge system. The stamp was issued in 1980 to commemorate the sesquicentennial of the founding of The Royal Geographic Society.

Ascension stamp, Scott #268 (not my stamp, which has yet to arrive)

I visited three islands of the beautiful Azores chain in 2016, and had a great time. All these islands, also on the Mid-Atlantic Ridge system, are largely volcanic, and I visited several great volcanic spots.

Sete Cidades volcano crater lakes, island of São Miguel, Azores

Saturday, December 18, 2021

IGY Bulletin, Number 6, December 1957 - Whistlers and related phenomena

According to the start of this article in the IGY Bulletin, "whistlers are naturally occurring audio frequency radio waves which, received on an antenna, amplified, and fed to a transducer for conversion into sound, can be heard as long descending whistles."

What do these sound like? Check out this YouTube video of a recording by amateur Mark Dennison in 2010:


This image of the spectrum of a whistler


shows the descending frequency (High pitch to low) of a 3-second whistler signal from over 2.5 kilohertz to about 500 hertz. This falls within the audio spectrum of human hearing from 20 hertz to 20 kilohertz. (Other animals can hear much higher frequencies than humans). 

A figure in the article shows a frequency-vs.-time graph for a whistler that looks the same as the above.

Figure 3 from the Bulletin article, for a whistler bouncing between Alaska and New Zealand. Dispersion D increases with time.

I had my first audiogram two years ago, and although I have the typical moderate falloff for older folks at higher frequencies, I fit into the range above:
My left ear

The Bulletin article points out that the significance of whistlers is that they can provide information about the very high atmosphere, above the altitudes accessible by rocket soundings.

As mentioned in an earlier post, whistlers are generated by the propagation of sferics which then exhibit the property of dispersion whereby signal velocity depends on the frequency. Sferics are transient radio waves arising from naturally occurring electric discharges in the atmosphere. The most intense sferics are produced by lightning.

The figure below from the article indicates how whistler will penetrate the ionosphere, then bounce back and forth between places like Annapolis and Cape Horn that are at the same geomagnetic latitudes in the northern and southern hemispheres, following flux lines (like the dashed one) of the geomagnetic dipole field. Data collected earlier in the year verified such whistler paths that had previously been theoretically calculated.


The article further lists stations set up for whistle observations for the US-IGY program, and gives some of the preliminary findings as of this December article.

I guess if you were an ionospheric scientist working on whistlers, this would be your theme song:


Interesting to read about Adriana Caselotti, the uncredited voice of Snow White.

Friday, December 17, 2021

IGY Bulletin, Number 6, December 1957 - Moonwatch observing methods

This short article in issue #6 of the IGY Bulletin (December, 1957) is an extension of the previous piece.

Moonwatch stations for visual observations of satellites were coordinated by the Smithsonian Astrophysical Observatory, organized by noted astronomer Fred Whipple despite some opposition from professional astronomers. The basic principle was to create a "meridional fence" and observe when that fence was crossed by a satellite. 

In what the article calls the "fundamental method" of observing, a team of observers would train their telescopes on the local meridian (longitude) as indicated by a north-south line and a vertical mast, such that the observing period spanned intervals of time and elevations where the satellite was expected. Then they could note the exact time (right ascension, in one celestial frame of reference) and elevation angle (aka the declination, but not to be confused with geomagnetic declination) where the satellite was seen. As indicated in the figure to the right from the article, the observers had overlapping fields of view so as not to miss the satellite. This must be what the "telescope array" photo that I included in the last post must be showing. Here is a frontal view of an observing team:

Volunteer satellite trackers in Pretoria, South Africa using the fence method, 1965 (Koch)

In the "differential method" of observing, the position of the satellite is measured relative to the known position of a star in the same field of view.

Btw, I find it strange that meridional with an "o" is the adjective form of meridian with an "a."

According to Jenny Koch,

the Moonwatch program lasted for 18 years, with its dedicated volunteers supporting over 400,000 valuable, time-consuming observations of satellites. Long after the buzz around Sputnik ended, Moonwatch remained relevant in providing a low-cost method of collecting satellite orbital data as well as data on the physics of the upper atmosphere. 
 Whipple the President’s Award for Distinguished Public Service from JFK in 1963, the highest civilian honor given to a government employee.

This seems to be a rather extensive guide for the amateur satellite spotter. It opens with the text:

If you have ever star-gazed shortly after sunset or before sunrise, you have probably noticed one or two "stars" sailing gracefully across the sky. These are Earth-orbiting satellites, visible due to the reflection of the Sun's light off their surfaces toward the observer. Hundreds of satellites are visible to the unaided eye; thousands are visible using binoculars and telescopes. Observing satellites has many enthusiasts around the world.


Wednesday, December 15, 2021

IGY Bulletin, Number 6, December 1957 - Volunteer participation in the IGY Earth Satellite Program

We move on to issue #6 of the IGY Bulletin, from December, 1957. A pdf of this issue (following the Nov. issue), downloaded from the Transactions of the American Geophysical Union, can be found here. This 16-page issue consists of the following articles:

  1. Volunteer participation in the IGY Earth Satellite Program
  2. Moonwatch observing methods
  3. Whistlers and related phenomena
  4. Arctic Ocean submarine ridges
  5. Oceanographic island observatory in Iceland
  6. Second Soviet satellite

In this post, I will review the first article, Volunteer participation in the IGY Earth Satellite Program

The launching of Sputnik on October 4, 1957, highlighted the value of volunteer efforts across the world for satellite tracking. The programs below were to be used for observing both U.S. and Soviet satellites.

The article lists four ways in which volunteers could contribute to the IGY Earth Satellite Program:

a) forming visual observation teams using simple optical instruments. These teams were organized by a special program of the Smithsonian Astrophysical Observatory, named Moonwatch (a former colleague of mine from the F&M astronomy program has a comment after the linked article). At the time of this Bulletin, over 100 such teams had been organized across the U.S., and 62 outside the U.S. It was reported that the Soviet Union had itself organized 66 such stations.

A simple (!) Moonwatch telescope used a mirror to reflect skylight upward into the objective, an arrangement that observing the sky comfortably for hours at a time. 

Moonwatch "telescope array" (Air Force Historical Research Agency)

b) establishing radio tracking stations in coordination with amateur radio clubs, universities, or other scientific groups. This effort was organized under a program called Moonbeam, a secondary network of less elaborate stations run by volunteers to complement the primary Minitrack stations mentioned in an earlier post. Moonbean enabled amateur radio operators to build a simplified version of the Naval Research Laboratory tracking stations for about $5,000 using a “Mark II” system (NASA).

c) recording telemetry signals of scientific data transmitted from satellites by radio and forwarding them to IGY centers. This was done by the same instruments that were used to do radio tracking of the satellites (b).

d) photographing satellite passages across the background star field by means of high quality cameras. A program for this has not yet been formed at the time of the article, but preliminary efforts of te Society of Photographic Scientists and Engineers (renamed in 1992 as the Society for Imaging Science and Technology) had been endorsed.

These efforts would today be termed examples of citizen science. The National Park Service describes citizen science as “when the public voluntarily helps conduct scientific research. Citizen scientists may design experiments, collect data, analyze results, and solve problems. In national parks, most citizen scientists collect data with tools provided by project directors. These data help professional scientists and resource managers answer scientific questions and solve important problems. And the activity helps participants build meaningful connections to science."

The North Museum of Nature and Science, across the street from my house in Lancaster, Pennsylvania, provides opportunities to participate in a citizen science project on plant phenology.

I used the collecting website colnect to search for stamps with the phrase "citizen science." It brought up a set of four Australian stamps commemorating citizen science that were issued last year. I don't own these stamps, but I include depictions and descriptions of them below.


Friday, December 10, 2021

IGY Bulletin, Number 5, November 1957 - The Special World Day Program for the IGY; CSAGI rocket and satellite conference

I'll review the last two articles in the Nov. 1957 issue of the IGY Bulletin.

1. The Special World Day Program for the IGY

I've discussed the IGY calendar in a previous post, including Regular World Days. This article focuses on Special World Days, on occasions of observed increases in solar activity that could also cause geomagnetic, ionospheric, auroral, and cosmic ray disturbances. Balloon and rocket soundings were increased during these events. The IGY World Warning Agency would send out alerts whenever solar activity, e.g., an unusually active sunspot region, was high and other disturbances were expected for the following day.

Table 1 in the article lists 45 World Warning Messages sent out during the first three month of the IGY, about one every two days. When the probability remained high for enhanced activity in the Earth environment, a Special World Interval would be declared.

Two of my U.S. IGY first day covers, not to mention the U.S. IGY stamp itself, depict solar activity. I haven't shown the first before, the cachet of which mimics the theme of the IGY stamp. The second was in an earlier post as an example of a hand colored cover.

FDC US139 from my collection, cachet maker unknown

FDC US173 from my collection

2. CSAGI rocket and satellite conference

There were a number of international meetings held to organize the IGY. This document on the contents of the National Academy of Sciences archives lists five CSAGI assemblies, five regional conferences, and five disciplinary conferences (if I am counting correctly). The first of these held in the U.S. was the CSAGI  Rocket and Satellite Conference, in Washington, D.C., from Sept. 30 - Oct. 5, 1957. 

During the closing session of the conference on Oct. 5, a brief description of the Sputnik 1 launch was given by A. A. Blagonravov. The launch from Kazakhstan had been made about 5 pm (Eastern  Daylight Time) the previous day, and had been announced at a reception that evening in conjunction with the CASGI satellite conference at the Soviet Embassy in Washington.

A number of resolutions were passed, including a recommendation that the U.S. and the Soviet Union arrange for the rapid dissemination of information on satellite orbits and the sharing of publications, technical data, and instrumentation.

The first day cover below from my collection was postmarked in association with the Fifth Assembly of the CSAGI held in Moscow from July 30-August 8, 1958. That meeting discussed the practical details of IGY data collection and utilization, and held symposia at which the first results of the IGY were presented. 

International cover #212 from my collection

The Russian stamp on the cover (image below), Scott catalog #2090, was issued for the IGY. It shows the schooner Zarja which was built in Finland in 1952 for the USSR Academy of Sciences (one of 50 wooden schooners built by Finland as reparations for the Continuation War fought against the Soviet Union by Germany and Finland during World War II). The research vessel was wooden, and non-magnetic, fully equipped with Soviet-built geophysical instruments, including special shipborne magnetometers (shown on the stamp) for geomagnetic field observations. The schooner covered 60,000 miles in less than three years, crossing the Atlantic Ocean six times and the Indian Ocean five times. In doing so, it helped to delineate marine magnetic anomalies. These anomalies (a difficult concept to explain which I may return to another time) were key in developing the theory of sea-floor spreading in the 1960s.

Scott #2090 (USSR), from my collection

Here is a silent video of the Zarja

A second Soviet cover from my collection with a CSAGI V cachet is shown below:

International cover #200 from my collection

The stamp on this cover is coincidentally Scott catalog #1957, issued by the Soviet Union on July 4, 1957, three days after the beginning of the IGY. It depicts the telescope at an observatory trained on a comet.

Scott #1957 (USSR), from my collection

Monday, December 06, 2021

A satellite that failed, and a Satellite that was a hit

Today is the anniversary of the first attempt by the U.S. to put a satellite into space. It didn't go so well. According to NASA, after the Soviet Sputnik success, the U.S. accelerated its two satellite programs programs. On December 6, 1957, the Vanguard Test Vehicle 3 (TV3) rose about 4 feet into the air, when the main engine lost thrust and the rocket fell back onto the pad, exploding in a huge fireball. The press called the failed attempt “Flopnik” and “Kaputnik,” in reference to its successful Soviet counterpart. The Vanguard satellite was thrown free of the explosion and recovered.  It is currently on display at the Smithsonian Institution’s National Air and Space Museum in Washington, D.C. I've been to the museum before, but now I want to go back and hunt this down.

Here is the newsreel as it happened:


Hang on, the U.S. will succeed before, too long.

I went to Harrisburg Saturday to see a concert by one of my favorite bands, The Hooters, iconic rockers from Philadelphia. I heard them 35ish years ago performing in the gym at Franklin & Marshall College, just a 5-minute walk from home. (Unfortunately, that concert put the kibosh on my editor's attending rock concerts, the volume being a bit excessive.) Then I heard them two years ago in Philadelphia at The Met in Philadelphia, a great venue, just before covid. Saturday the band played at club XL Live in Harrisburg, a more intimate setting. Excellent show! Here is my video clip from their performance of Satellite:


Here is the original music video. The song isn't about Vanguard TV3, or any physical satellite for that matter, but about televangelism. It does have the magic word for its title!


And here is a recent performance of Day by Day, probably my favorite Hooters song:


"Nothing lasts forever, only fades away, day by day ... chance you gotta take, price you gotta pay, day by day"

More satellite songs to come in some future post. 

Friday, December 03, 2021

IGY Bulletin, Number 5, November 1957 - Preliminary report on rockoon firings in the Arctic; Peary-MacMillan Arctic Museum; Matthew Henson

Ack, my summaries of November 1957 IGY Bulletin articles have now slipped into December. Plus, the articles are continuing to repeat themes, as rockoons were discussed in another post less than a month ago. So I'll be quick about the rockoons this time, and add some other Arctic thoughts.

The article states that during a 10-day period in August 1957, 18 rockoons (balloon-launched rockets) were flown as part of the US-IGY program by scientists from the University of Iowa, under the direction of James Van Allen. The flights were made from the deck of the USS Plymouth Rock, roughly within the Arctic-subarctic zone outlined in red on the map below. A table of all 18 flights is included in the article. Seven flights recorded data throughout the balloon ascent and rocket flight portion of the missions.

Approximate map area of rockoon launches (Google Earth)

The Hawk sounding rockets were launched at balloon altitudes of about 75,000 feet, or 15 miles, reaching as high as 132 km, or about 75 miles. This took them up to the altitudes of the aurorae, in the thermosphere/ionosphere.

Scientific objectives included measurements of the geomagnetic field, cosmic ray intensities, and of electrical currents. One of the instruments flown was a proton precession magnetometer. I used such a magnetometer, the Geometrics model G856, in my (ground-based) teaching and research at archaeological and geologic sites during my career.

Since we are now "in the Arctic," I'll take the opportunity to mention a couple of "Arctic experiences" I had during a trip to the Northeast in late September. I took my first airplane flight of the covid era from Philadelphia to Portland, Maine. On my way to Acadia National Park, I visited the Peary-MacMillan Arctic Museum at Bowdoin College in Brunswick, Maine. James Tanzer, Museum Outreach Coordinator, was kind enough to arrange my visit, these days by appointment only as campus buildings are generally closed to those from outside the Bowdoin community. The museum 

Hubbard Hall, housing the Arctic Museum
"is dedicated entirely to all things Arctic. It is named after Arctic explorers and Bowdoin graduates Robert E. Peary (Class of 1877) and Donald B. MacMillan (Class of 1898)." Peary (1856 – 1920) was an American explorer and officer in the United States Navy who made several expeditions to the Arctic in the late 19th and early 20th centuries. He is best known for leading an expedition in 1909 that claimed to be the first to have reached the geographic North Pole, although he might have bean beaten by Frederick Cook. The other namesake of the Museum, Donald MacMillan, received a bachelor's degree in geology from Bowdoin. He made over 30 expeditions to the Arctic in his 46-year career, traveling over 300,000 miles.

The coolest artifacts in the museum were Peary's notes and telegram about reaching the pole:


It was also neat to see some of the surveying and scientific instruments used on the expeditions. Just like what would be done for the IGY 50 years later, temperatures and barometric pressures were measured as key weather variables.


Thermometer

Barometer

Barometric and thermometric data


I have a first day cover for  the 50th anniversary of Peary's expedition to the North Pole. The 1959 stamp (Scott #1128) shows Peary’s expedition with a team of dog sleds traveling over the ice, and the USS Nautilus’ 1957 nuclear-powered submarine journey below the ice, two rather different ways of reaching the North Pole. The postmark is from Cresson, Pennsylvania, where Peary was born.

First day cover with Scott #1128 for the stamp. The cover is  US 194 in my collection.

I appreciated learning more about Matthew Henson at the Museum. Henson (1866 - 1955) accompanied Peary on seven voyages to the Arctic over a period of nearly 23 years spending a total of 18 years on expeditions together. (Wow, that's half the lifetime of my marriage!)  He was part of the 1908–1909 expedition that claimed to have reached the geographic North Pole on April 6, 1909. Henson said he was the first of their party to reach the pole. Henson, being Black, got only subdued and belated kudos for his accomplishment. I

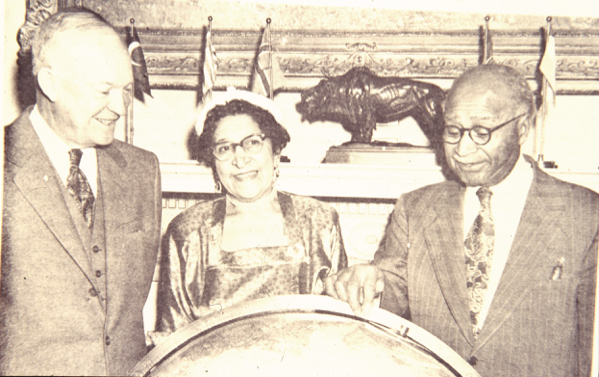
There is a small virtual exhibit at the Museum on Henson. Sadly, Henson did not live to see the IGY. But there is a picture of him from the virtual exhibit with Pres. Eisenhower, our IGY president, in 1954:
Matthew and Mrs. Henson with President Eisenhower at The White House; age 88 (Bowdoin College)

I ran into Henson again when I spent a night on the same trip in Mystic, Connecticut, and visited the Mystic Seaport Museum. Although he does not show up when you google his name through the Museum's website, there was a panel on him, shown below. It pointed out that the shipbuilding community near Mystic had sent many whaling vessels into the Arctic in the mid-1800s, before Henson went there for a different reason.
Matthew Henson panel at Mystic Seaport Museum


In my collection, I also have the USPS Souvenir Page (Scott catalog SP752) shown below, with four 22¢ stamps issued in 1986 showing Arctic explorers: Elisha Kane (Scott #2200), Adolphus Greely (Scott #2201), Vilhjalmur Stefansson (Scott #2202), and Robert Peary and Matthew Henson (Scott #2203) sharing the fourth stamp. Henson had to share a stamp, but at least he got one. 


USPS souvenir page (SP267) on Polar Explorers, including the stamp (Scott #2203) with Matthew Henson and Robert Peary

The block of four stamps together has its own designation in the Scott catalog as #2223a.

According to the Scott catalog, these souvenir pages "are post office new-issue announcement bulletins, including an illustration of the stamp's design and informative text." Although the stamps are individually listed in the regular part of the catalog, the souvenir pages are indexed separately as "back of the book" items, found further back in the Scott catalog in the same way as airmail stamps are, and bearing the extra SP prefix.